


Last week we saw continued deterioration off the recent highs as the major averages slid lower on fears of a US debt default. Although no deal is yet in place, the market responded in hopes that a default could be avoided and prices spiked higher from their lows on Wednesday in violent fashion. One has to wonder what happens once a deal actually gets announced, and whether prices are now poised for a sell-the-news reaction.
As we head into a new week of trading, it’s time once again to take a look at the indexes and the key levels they’re dealing with. This will impact how individual names move, so it’s where every new trading week begins.
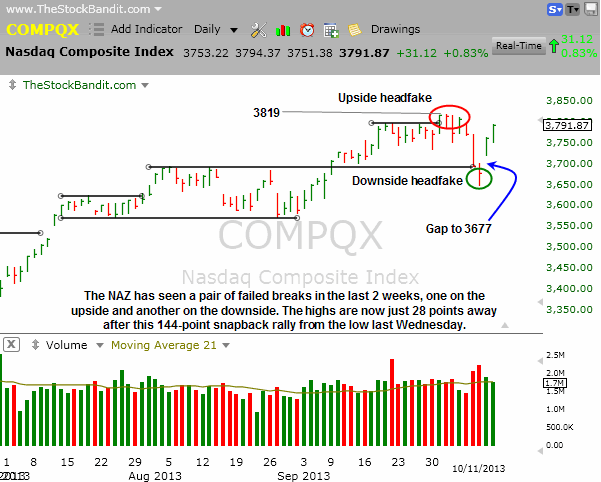
NAZ – The NAZ has seen a pair of headfakes in the last 2 weeks: one to the upside, and one to the downside. As the new trading week begins, this index sits some 28 points from its high but 141 points off its low from last week with a sizeable unfilled gap.
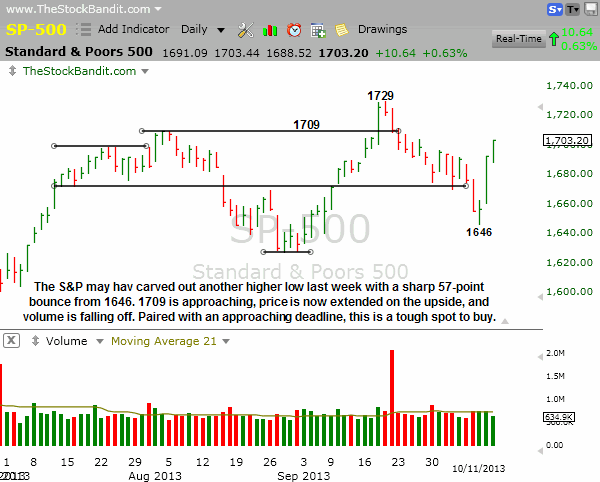
SP500 – The S&P vaulted higher by 57 points from the low on Wednesday to Friday’s closing bell. That put an end to the persistent weakness we’ve seen, and may have carved out a higher low in the process. Prior resistance at 1709 and 1729 are still overhead.
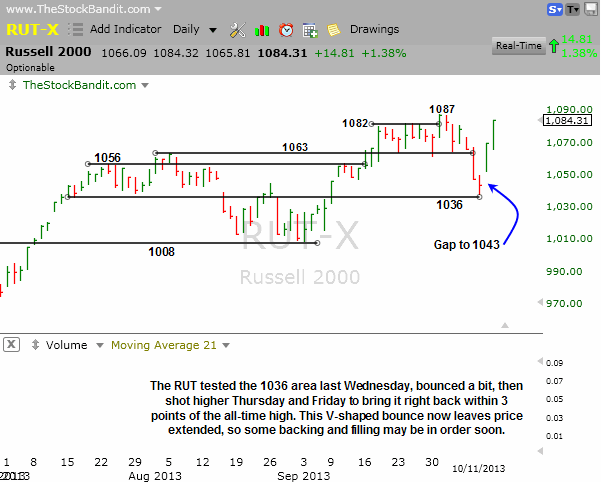
RUT – The RUT spiked by 47 points from its low on Wednesday into Friday’s close, leaving the small-cap index just 3 points from its all-time high. An unfilled gap is on the chart to the 1043 level, but it will be most interesting how this index gets treated as the highs are tested.
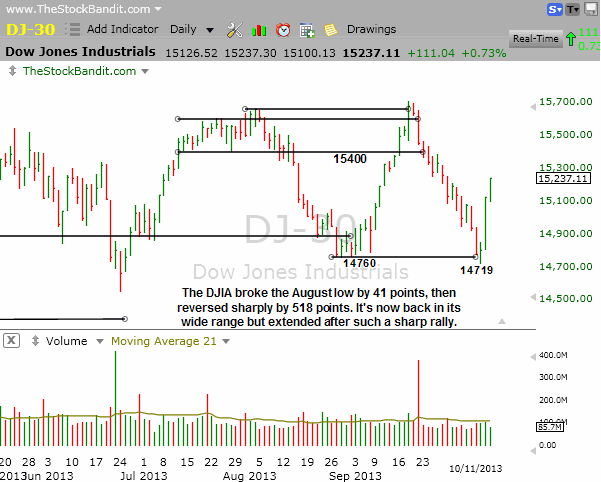
DJIA – The DJIA had been the picture of a steady slide until last week when it incrementally broke the August low then vaulted 518 points into Friday’s closing bell. This index is now in no man’s land as there isn’t a level anywhere near current prices. On the way up is 15400, whereas the 14700 area has just held as support twice.
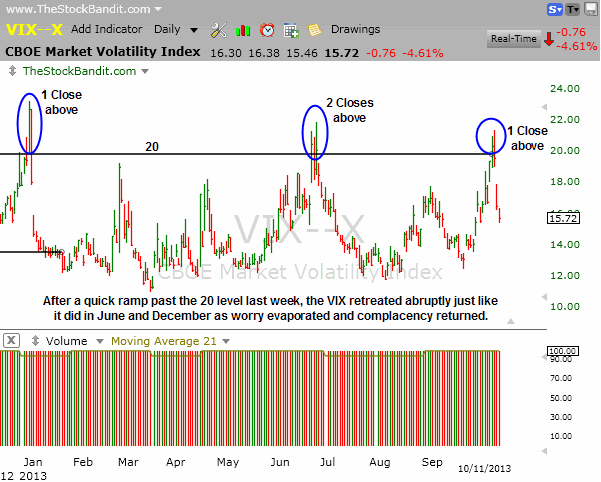
VIX – The VIX maintained its habit of only being able to hold above 20 for a very brief time last week as it chalked up a single close beyond that level before tanking back into the range, just like it did last December and then again in June. Fear subsided quickly, but a US debt default could change that again quickly, so this is an index to keep on the radar this week.
Take a trial of the Stock Pick Service to get my trades.
Trade Like a Bandit!
Jeff White


