


What had been a quiet week became turbulent on Thursday with nasty selloffs across the board. However, stocks recovered immediately with a snapback rally on Friday which erased the Thursday decline, in some cases almost to the penny. That leaves the major averages range-bound, but gives traders a reminder that anything’s possible in either direction here.
As we head into a new week of trading, it’s time once again to take a look at the indexes and the key levels they’re dealing with. This will impact how individual names move, so it’s where every new trading week begins.
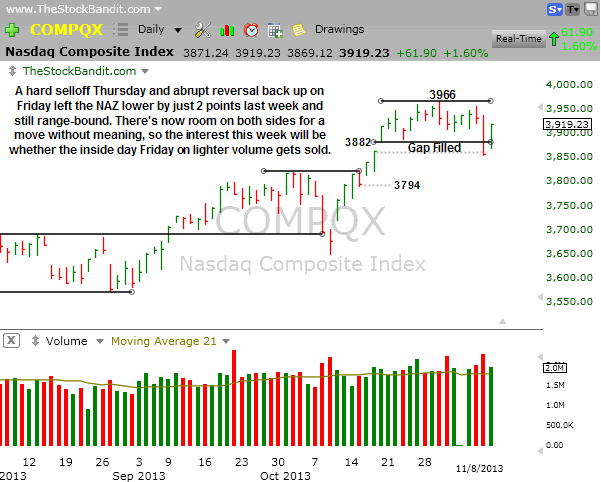
NAZ – The NAZ broke support to fill a gap from October, then lifted big on Friday to finish back inside the range. This makes for sloppy trading in the short term, but continued basing action has now fully digested the October rally, which badly needed to happen. 3966 is the number to watch on the upside, while 3855 is Thursday’s low to keep on the radar. A downside break could bring the next unfilled gap to 3794 into the picture.
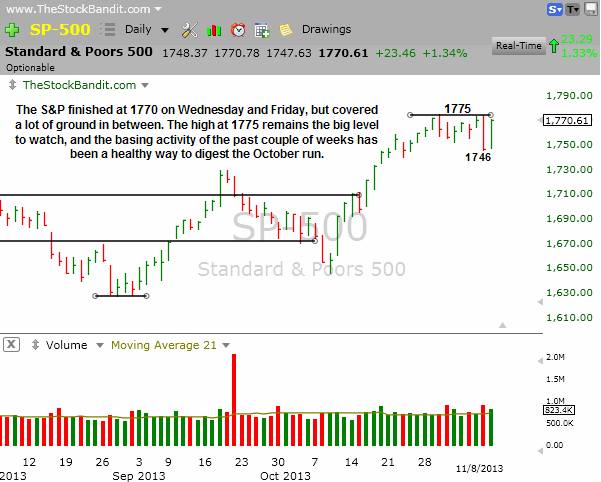
SP500 – The S&P fell apart on Thursday, only to recover the same amount (23 points) on Friday to finish at 1770, Wednesday’s closing level. It’s once again within just a few points of new-high territory, with 1775 being the number to watch on the way up. Beyond that, it’s blue sky for this index, but the bulls will need to give it a nudge to exit this high-level consolidation zone.
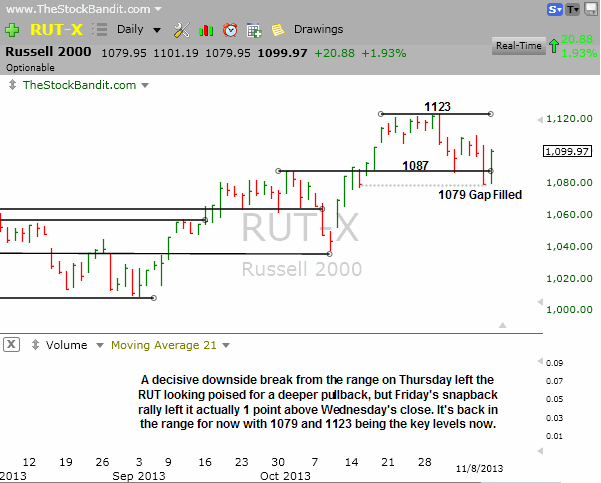
RUT – The RUT looked poised for a much deeper retracement after Thursday’s break of 1087 support and gap fill to 1079 from October to post its 6th decline in 7 sessions. But with Friday’s arrival came a surprise move right back up to finish 1 point above Wednesday’s close of 1098. It’s now back inside the range with room to move higher or lower to some extent before something technically meaningful happens.
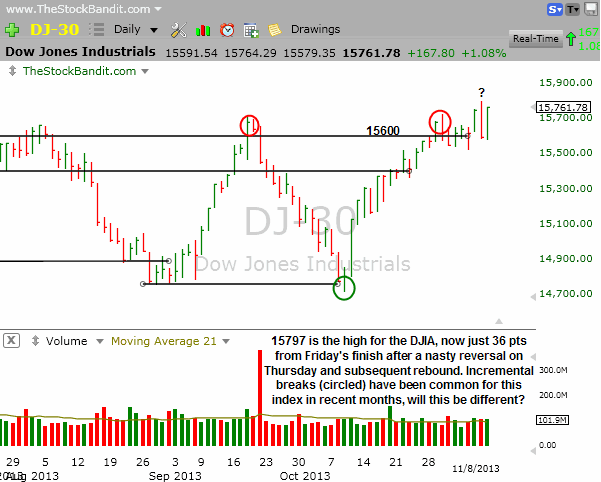
DJIA – The DJIA has tagged 15600 in almost every session for the past 2 weeks. Incremental new highs/lows have plagued this senior index with subsequent reversals, so last Wednesday’s new incremental high looked poised to follow the same playbook when Thursday’s bearish engulfing bar got painted. However, Friday’s rally left this index shy of its intraday high but sitting at a new all-time closing high. The door is open for more upside, but for it to stick in this index we’ll likely need to see some of the others achieve a similar feat (S&P).
Take a trial of the Stock Pick Service to get my trades.
Trade Like a Bandit!
Jeff White


