Stocks stumbled last week with the bounce from the prior week quickly getting sold. The failure created a lower high for the S&P 500, the DJIA, and the RUT, turning the short-term direction downward. Across the board, we saw declines of 1.5 to 2.1%, which was certainly a change of pace for this market after such persistent strength.
As we head into a new week of trading, it’s time once again to take a look at the indexes and the key levels they’re dealing with. This will impact how individual names move, so it’s where every new trading week begins.
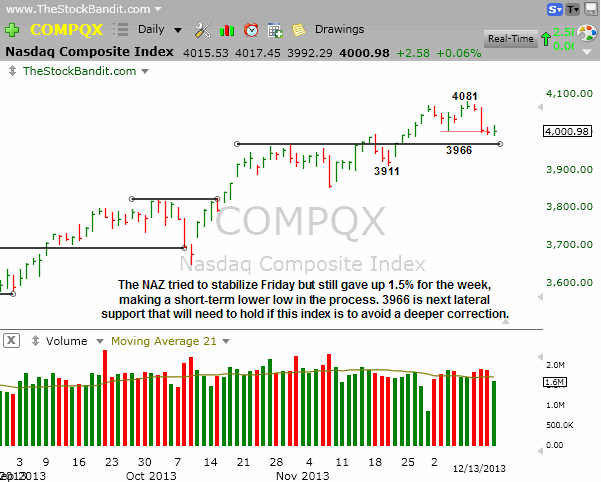
NAZ – The NAZ gave up 61 points last week with a feeble Monday lift to new multi-year highs followed by heavy price action into the remainder of the week. It established a lower short-term low (red line) as it broke below 4004 from early this month and ultimately finished right at 4000. Next level to watch is 3966 from October, as a break below that could see profit-taking accelerate.
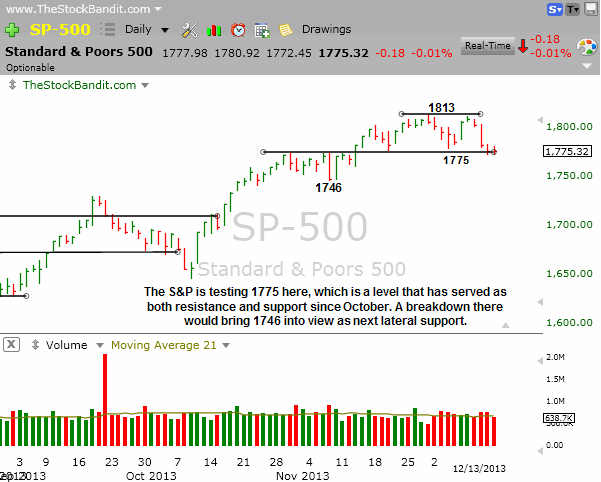
SP500 – The S&P saw a minor advance last Monday which stopped shy of the 1813 high to make a lower high, then rolled over hard to test the 1775 area where it ultimately finished the week. This has been a big level going back to October as we’ve seen it serve as both resistance and support in Q4. A downside break would open the door to 1746 as next lateral support.
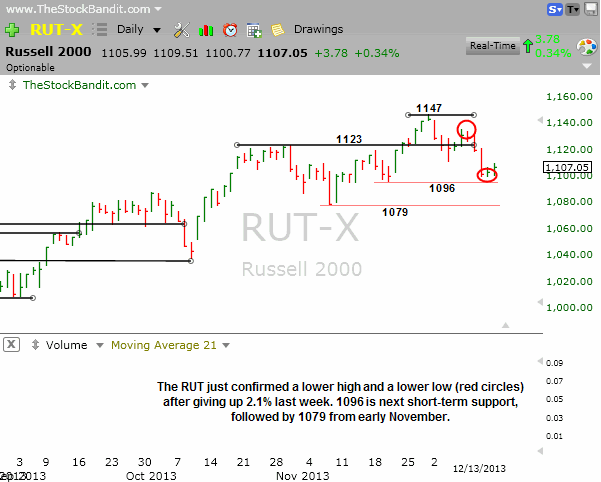
RUT – The RUT led the way lower last week as cash got raised aggressively in small-caps. That brought a lower high and a lower low with a 2.1% decline in this index. It’s now 40 points off its recent high, and just a short distance from the next lateral level of 1096 where support was found in mid-November. The late-week bounce wasn’t impressive, and I’d expect to see 1123 serve as resistance now that we’ve seen such a decisive break below that level.
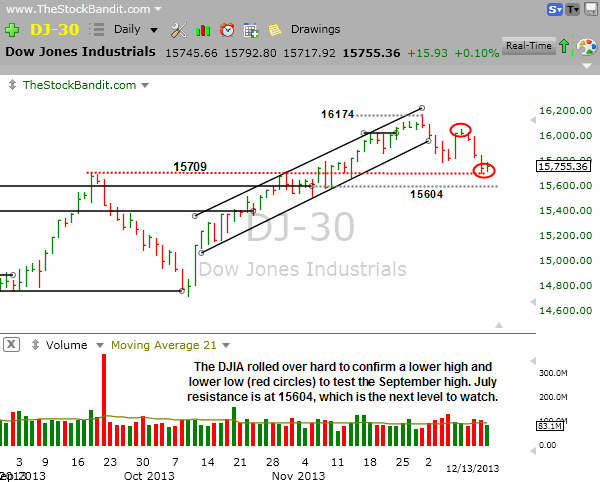
DJIA – The DJIA shed 264 points last week as a poor finish to Monday’s advance segued into a hard selloff mid-week. That brought about a test of the September high and now leaves this index with both a lower high and a lower low. Upside has been rare over the last couple of weeks, with the jobs report rally the prior Friday standing out like a sore thumb in what has otherwise been persistent weakness.
Take a trial of the Stock Pick Service to get my trades.
Trade Like a Bandit!
Jeff White


