Stocks continued to ramp last week since turning up from the mid-April low, packing a serious punch to the bears after a Wednesday pullback with back-to-back triple-digit gains on Thursday and Friday.
As we head into a new week of trading, it’s time once again to take a look at the indexes and the key levels they’re dealing with. This will impact how individual names move, so it’s where every new trading week begins.
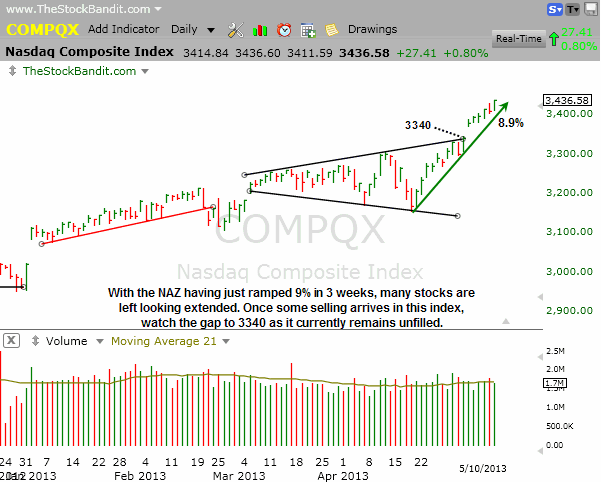
NAZ – The NAZ just added 9% in about 3 weeks, which simply isn’t a sustainable pace. Nonetheless, the bulls remain in charge here and there’s no reason to become bearish even if a short-term pause is becoming overdue.
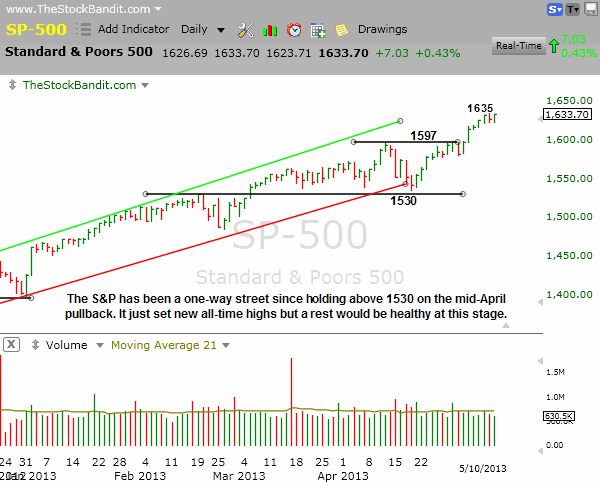
SP500 – The S&P continues to grind higher since its breakout two weeks ago through 1597 resistance. It has some breathing room here to potentially pull back on profit-taking and perhaps still hold the 1597 level. Either way, a higher low looks likely on the next pullback after this 100-point advance. Based on the height of the rectangle pattern it just broke out from, this index could see a measured move up to the 1665 area. At this pace, it wouldn’t take long either.
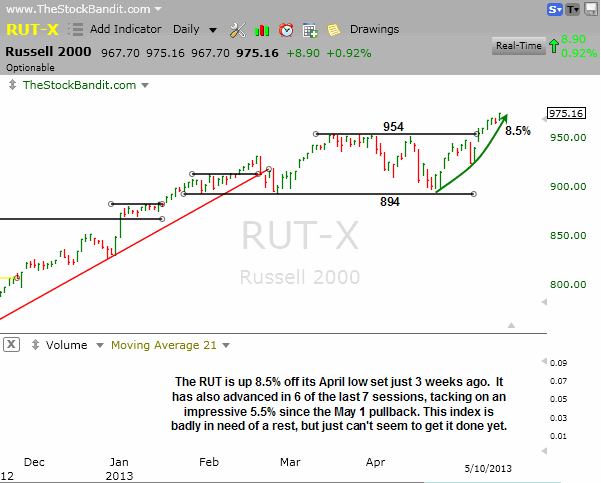
RUT – The RUT closed at a new all-time high on Friday and now stands 21 points above the breakout zone. That allows for some room should profit-taking kick in, although the last pullback low is now nearly 80 points away. A measured move from the rectangle pattern takes this index up to 1015, although pauses along the way could make that an easier accomplishment.
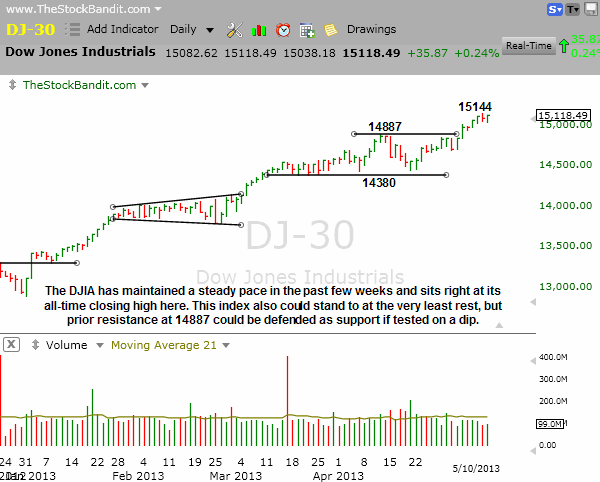
DJIA – The DJIA keeps easing higher since its breakout and still has room to fulfill a measured move to the 15380 area based on the height of the rectangle pattern it just left behind.
Take a trial to our Stock Pick Service to get our trades.
Trade Like a Bandit!
Jeff White


