The major averages churned last week, giving nobody satisfaction. The relentless run higher was put on hold for all but the NAZ, yet no pullback was provided for bulls to allocate additional funds or for bears to cover shorts into. It was by all measures a standoff.
As we head into a new week of trading, it’s time once again to take a look at the indexes and the key levels they’re dealing with. This will impact how individual names move, so it’s where every new trading week begins.
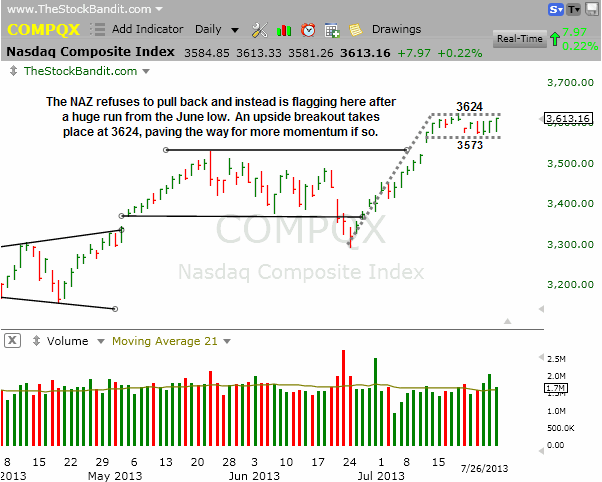
NAZ – The NAZ led the way last week, thanks in part to positive earnings reactions to AAPL, FB, AMZN, SBUX and others. This index was the only one with a meaningful gain, although it held inside its recent high-level base to continue building the large bull flag pattern. A breakout to a new high could see this index stretch its legs further, which would happen beyond 3624. A pullback would be ideal, but it just can’t seem to pull it off.
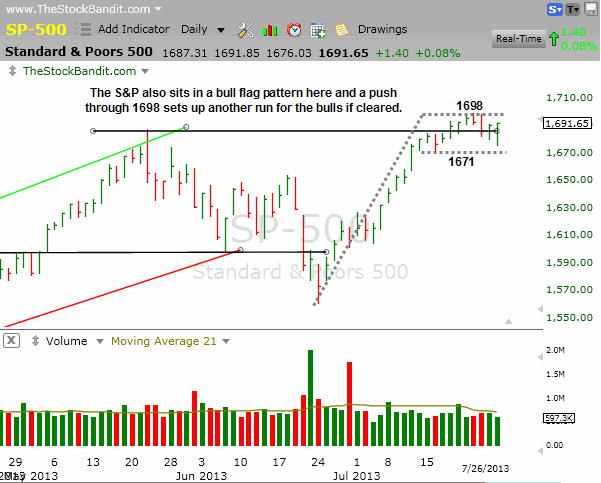
SP500 – The S&P continues to churn just beneath 1700, and this index also has not been able to put together even a modest pullback. Even quiet declines on Thursday and Friday were each met with afternoon strength, erasing the deficits for each session and leaving this index at its highs by the closing bell. We’ve seen a little bit of rest, but no pullback. Any breakout through 1700 will need to stick, as a breakout followed by a reversal would be viewed by many as a short-term last gasp for this big lift off the June lows.
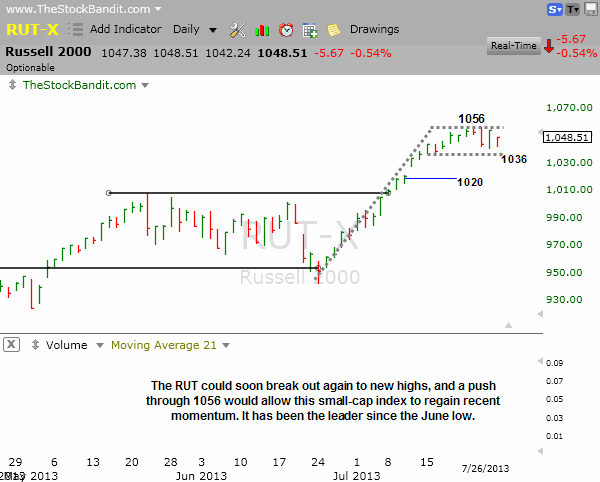
RUT – The RUT remains just a few points shy of its highs as well, but has attempted to pull back a bit in the past few sessions. This daily chart has a bit more of a rounded look to it than the other flags we’re seeing. Nonetheless, it too is proving to be very resilient despite having become extremely overbought just a few short days ago. Keep a close eye on the high at 1056 and the unfilled gap below with room to 1020 just in case it rolls over.
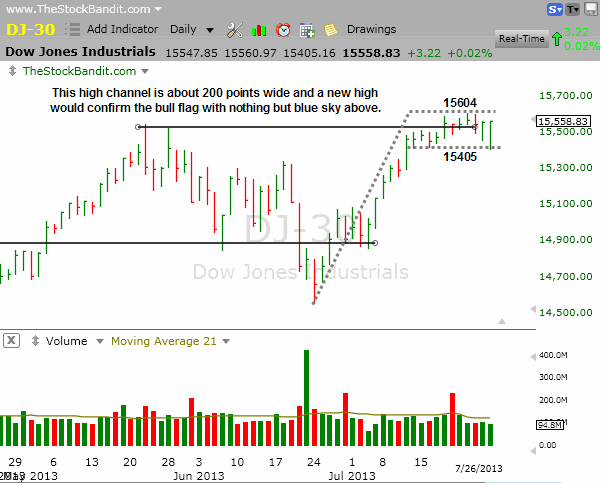
DJIA – The DJIA is the least extended of the bunch, yet it isn’t likely to take off without the others. For now, it’s in rest mode and that’s certainly a positive way to digest the recent run off the June low. The high is at 15604 and a solid push through there would confirm this bull flag-like pattern, paving the way for much higher prices.
Take a trial of the Stock Pick Service to get my trades.
Trade Like a Bandit!
Jeff White


