


The major averages broke out last week, but with varying degrees of intensity. We’ll need to see better unity if this fresh advance is to have legs, so the week ahead will be a very important one for the bulls.
As we head into a new week of trading, it’s time once again to take a look at the indexes and the key levels they’re dealing with. This will impact how individual names move, so it’s where every new trading week begins.
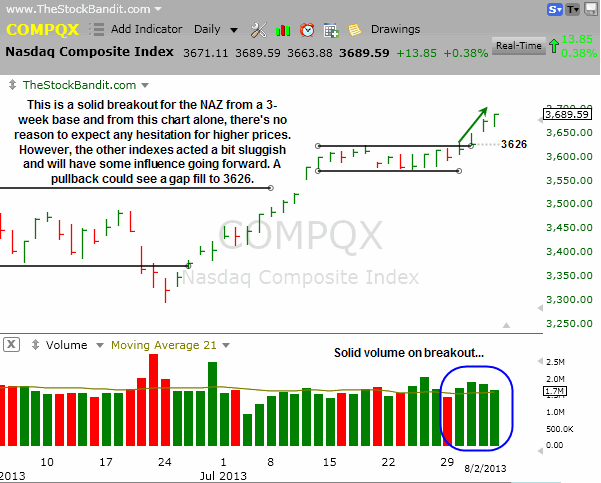
NAZ – The NAZ exhibited the most strength last week with a hesitation breakout Wednesday followed by a big day Thursday and some follow through on Friday. It has plenty of room to breathe now, with the gap to 3626 being the next downside level to watch. Just beneath that is the prior high just 2 points lower at 3624.
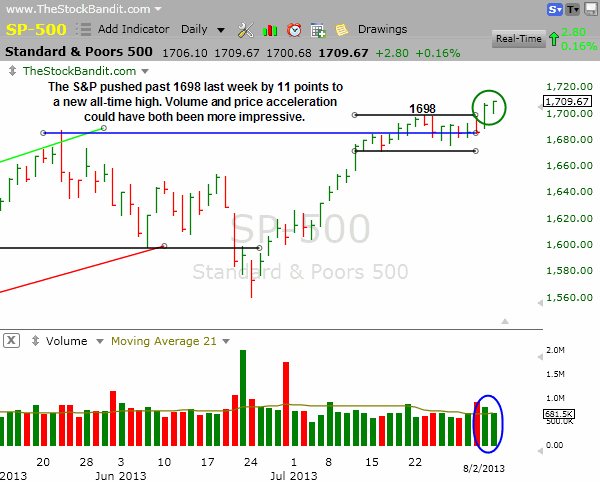
SP500 – The S&P cleared the 1700 level last week, but still isn’t far from it. Volume wasn’t overly impressive either, which means the bulls still have some work to do if they intend to build on this breakout in a more convincing fashion. This is a new all-time high and that should not be discounted, but the breakout needs to stick.
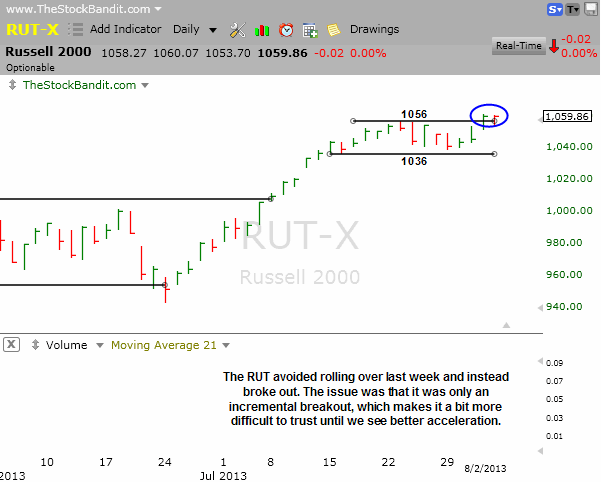
RUT – The RUT avoided the rounded top that still looked to be in play even mid-week last week and pushed north to reach a new all-time high. Here again though, this is only an incremental breakout and therefore the bulls still have some proving to do if it’s going to stick.
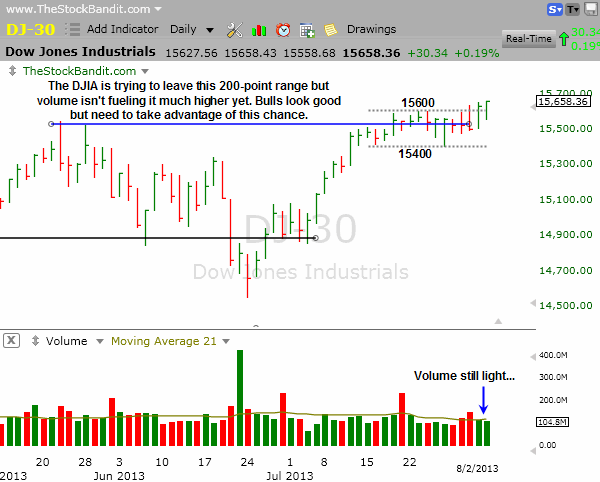
DJIA – The DJIA has spent the bulk of the past 3 weeks in a 200-point range between 15400 and 15600. On Thursday and Friday, it closed above 15600 but still is only a few points from it. Volume was light, making this breakout a bit suspect until greater acceleration in price or stronger volume is seen to accompany the start of this new advance.
Take a trial of the Stock Pick Service to get my trades.
Trade Like a Bandit!
Jeff White


