Last week we saw some rest and retreat, depending upon the index. Small caps held strong with techs, while the blue chips and financials slid with some consistency off their recent highs. That divergence will be resolved at some point soon, but which side is proving to be the leader here?
As we head into a new week of trading, it’s time once again to take a look at the indexes and the key levels they’re dealing with. This will impact how individual names move, so it’s where every new trading week begins.
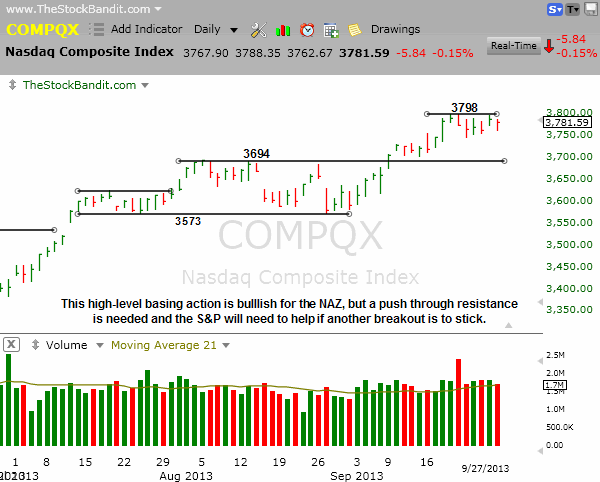
NAZ – The NAZ added about 7 points on the week last week as it continued to respect 3798. This base-above-base look is certainly bullish, and there’s some additional room for the projection to 3814 out of the July/August trading range, but the bulls are still waiting for the right motivation to make it happen. At the very least this pause has been healthy to work off the overbought conditions we saw a week ago.
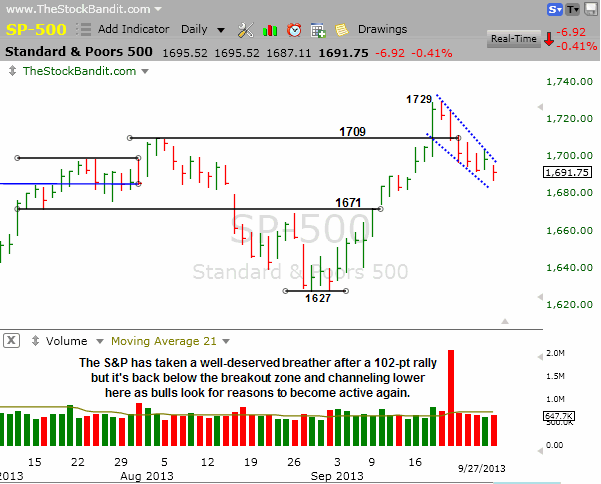
SP500 – The S&P is channeling lower here in the short term as it retraces some of the 102-point rally off the August low. The failed breakout through 1709 doesn’t help the bull case here, and neither does the persistent weakness of late. However, a breakout on the NAZ could certainly see a sympathy rally in this index. Next support is 1671 if we continue to slide.
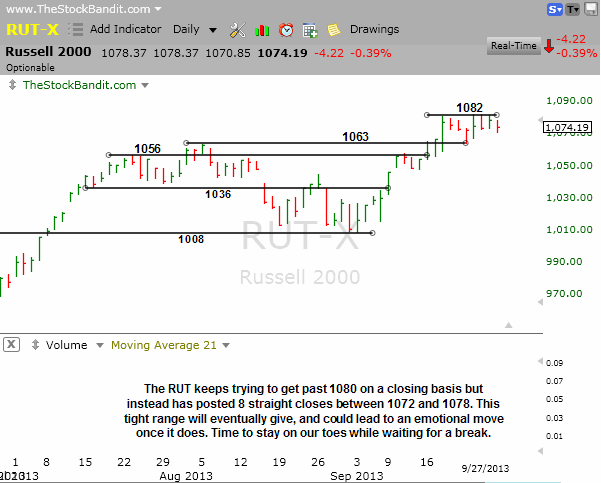
RUT – The RUT keeps finishing in a tight range and is sitting just shy of its all-time high set intraday last week at 1082. This rest is healthy after the nonstop lift from the August low, but if continuation is going to happen sooner than later this index will need to hold the 1063 breakout, otherwise it’s likely in for a pullback. Even in the latter scenario this index has ample room to pull back and still create another higher low, so the bulls remain in good shape.
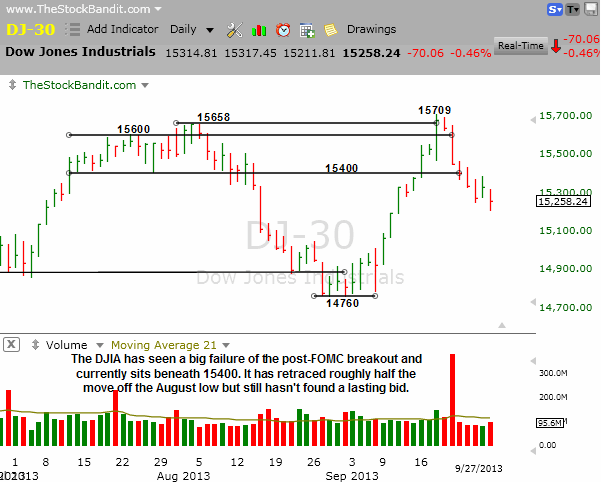
DJIA – The DJIA tried to break out two weeks ago and abruptly failed. Since then it’s been persistently weak with even last Thursday’s bounce finishing well off the session high. Friday’s session marked a new pullback low. Some stabilization here could carve out a higher low, but the bulls likely have a little emotional baggage in the short term after the breakout failure.
Take a trial of the Stock Pick Service to get my trades.
Trade Like a Bandit!
Jeff White


