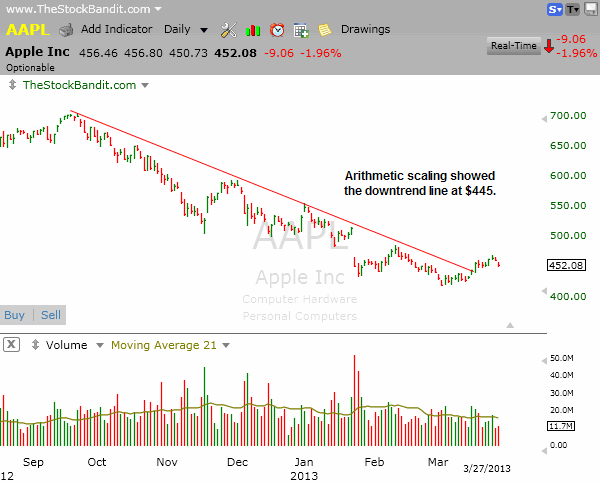
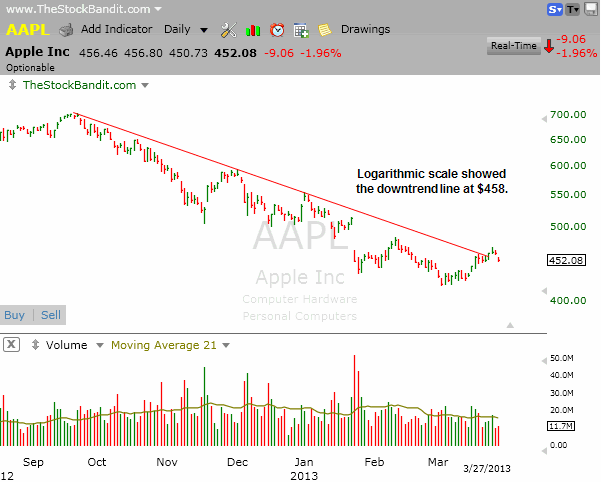
I was asked this past week why AAPL looked to be above a downtrend line on one chart but beneath the same downtrend line on another. Great question!
The short answer is that the scaling is different on the two charts.
You might have seen the words ‘arithmetic’ and ‘logarithmic’ in your charting program or your trading platform and wondered what they were. Aside from fancy words you might want to throw around at your next cocktail party, they’re really just references to the spacing of price on your charts. Arithmetic charts depict price moves in equally fixed increments, whereas logarithmic charts depict percentage moves in equally fixed increments. There’s more to them than that, but for the purpose of this post, that’s the grass-roots difference. (For a much more in-depth explanation, here’s a video from the Khan Academy.)
Who, you might ask, would use one over the other? I’m glad you asked! Generally, longer-term traders and investors prefer logarithmic charts as they’re wanting to see percentage moves to scale. And typically you’ll find that shorter-term traders prefer arithmetic charts as they want to see similar $ moves to scale.
What’s so interesting is that even though the same prices are being plotted on a chart, it can give you a bit of a funky comparison when looking at one vs. another. At the top of this post I mentioned AAPL in relation to its downtrend line. It’s now above that trend line on both arithmetic and logarithmic charts, so I’ve clipped back the chart a few days for the purpose of this example.
On the arithmetic chart, AAPL cleared its downtrend line on March 18 as it cleared the $445 level (which I happened to highlight the night before for members).

On the logarithmic chart, however, AAPL remained beneath its primary downtrend line until it cleared the $458 level on March 22.

These two charts highlight very distinct differences even for a very basic trend line crossing. The arithmetic scale provided an earlier entry in price ($13) in this case, whereas the logarithmic scale required more time before price appeared to be on the move. To a swing trader like me utilizing trend lines frequently, that’s a significant difference.
Decide what’s best for you, and understand which of the two are most relevant to your trading style and timeframe.
Trade Like a Bandit!
Jeff White
Take a trial to our Stock Pick Service to get our trades.


