Being a pattern-based trader for most of my stock plays, I care a great deal about the appearance of a chart.
But…looks aren’t everything.
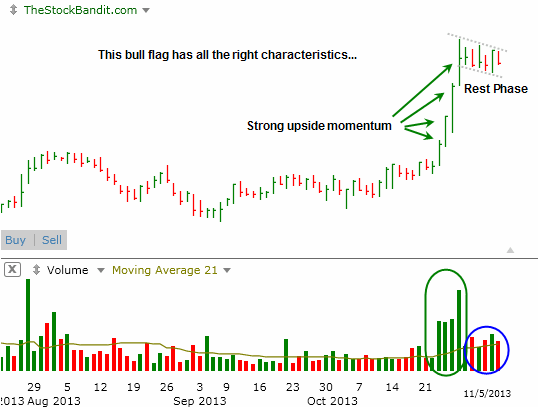
Take this stock, for example. Bull flag pattern. Excellent momentum ahead of the rest phase. Strong upside volume accompanied the rally, and volume has gotten relatively quiet as price moves laterally. That’s all great and exactly what I like to see:
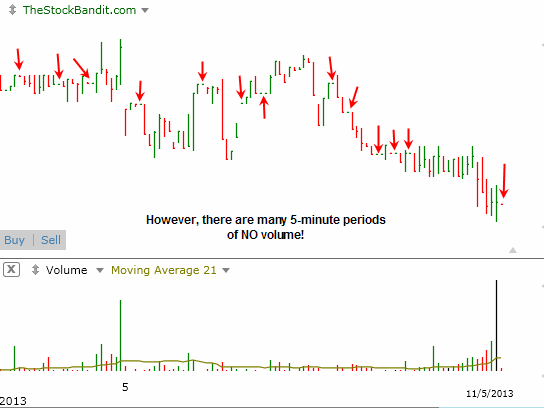
But a closer look reveals a glaring problem: total volume. Before we discuss “the number,” let’s glance at the 5-minute chart just to get an idea of activity (or lack thereof). Note the many dashes. Those are each 5-minute periods where price made no move at all, and in some cases saw ZERO volume! That isn’t the kind of issue you want to be focusing on in trading if you expect to be able to stay remotely nimble:
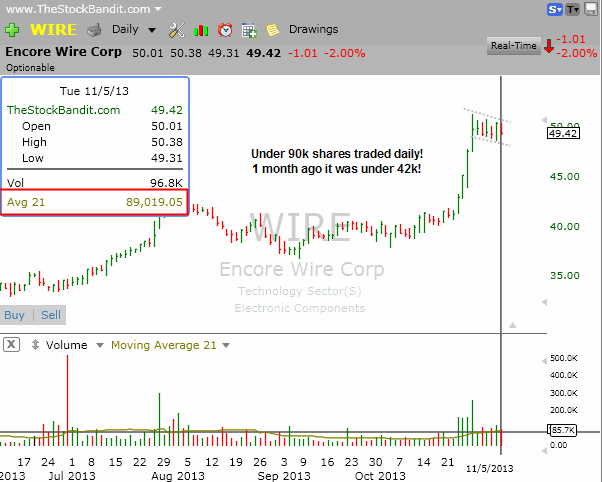
I’ll reveal the mystery here… WIRE is the ticker. Average daily volume over the past 21 days (1 month) is just over 89,000 shares. That’s just not enough liquidity to consider it to be a tradable stock (and by ‘trade’ I mean be active in it with the ability to efficiently enter and exit). Volume has ramped considerably over the past month, as a month ago it was below 42,000 shares on an average day. So it is moving the right direction, it’s just not ‘there’ yet.
Here’s the point:
Always consider total volume as a key measure of liquidity (bid/ask spread is certainly another). Total volume gives you an idea of just how much involvement there is for any given day. It should be one of the very first things you look at when you pull up a chart.
I don’t want to be a big player in any name – I want someone else making the waves and I just want to be able to hop on for part of the ride. When liquidity is this thin, there ARE no big players! That means price can gap easier intraday, and it takes far less to move the stock in either direction. One poorly-timed market order can run price a few dimes, resulting in awful executions. One decent limit order could spook prices the other way temporarily.
Thinly-traded stocks might have their place, just be sure you stay extremely small if you’re planning to remain active and you want to participate in them.
I share my trades with subscribers all the time, and I only stick with liquid names (usually 500k or heavier daily average volume). Check out the trial if you’d like to kick the tires.
Trade Like a Bandit!
Jeff White
Take a trial to our Stock Pick Service to get our trades.


