Stocks on streaks just draw attention. How many more days? How much farther can it carry? When will it shift?
While those questions may come naturally, reality can bring a variety of answers depending upon the situation. There is no one-size-fits-all answer.
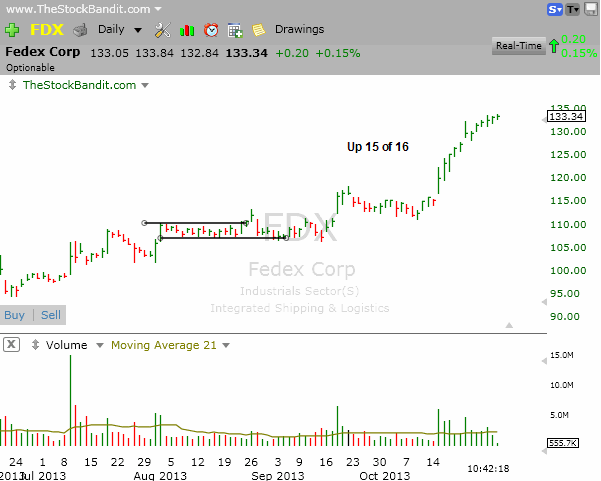
Seeing a stock that’s run a considerable distance, such as FDX right now, invites faders. There’s an expectation of mean-reversion to some degree in the near term after seeing a stock like this run higher in 15 of the last 16 sessions. (That’s just 1 decline in over 3 weeks of trading).
But shorting into strength can be a recipe for disaster. The fact is, momentum is the proverbial freight train – whether up or down – and you don’t want to step out in front of it without a well-defined plan!
Arbitrarily picking a top or a low rarely plays out, but in the case of FDX, there’s a case to be made for a short-term pullback here. Keep in mind, that doesn’t necessarily mean the end of the run. It just means the odds for some profit-taking are elevated. It might defy gravity a while longer, but here’s what I see.
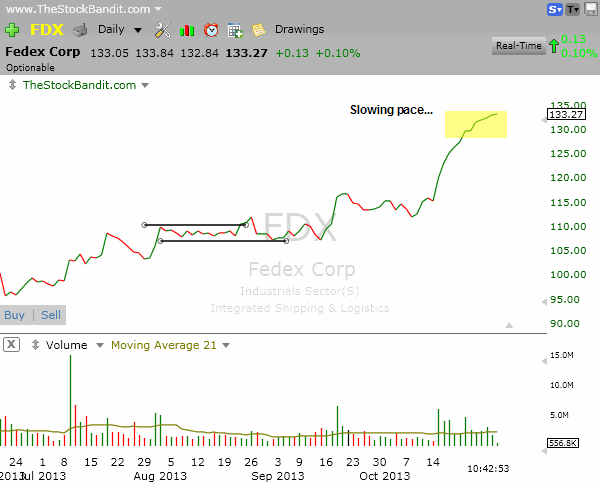
The runup has been impressive, no question. However, the pace of the move has slowed considerably in recent days, which is to say it appears to be losing some steam. The HLC chart shows it, but we’ll take a closer look at the rarely-used line chart in a moment that depicts it even better. Here’s the HLC chart of FDX where it currently sits:
Here’s the line chart, which in this case provides an excellent look at the slowing pace of the FDX rally on day 16:
These types of fade plays require you to stay quick and nimble. There are shorts in pain who are eager to cover on any dip, and those who are enamored with the stock could just as easily aggressively buy more at lower prices. Those two dynamics alone could keep a pullback shallow with a built-in bid.
If you’ve been eager to be a seller of FDX, it looks to finally be stalling out here. Now just watch for some red and don’t overstay your welcome.
Trade Like a Bandit!
Jeff White
Take a trial to our Stock Pick Service to get our trades.


