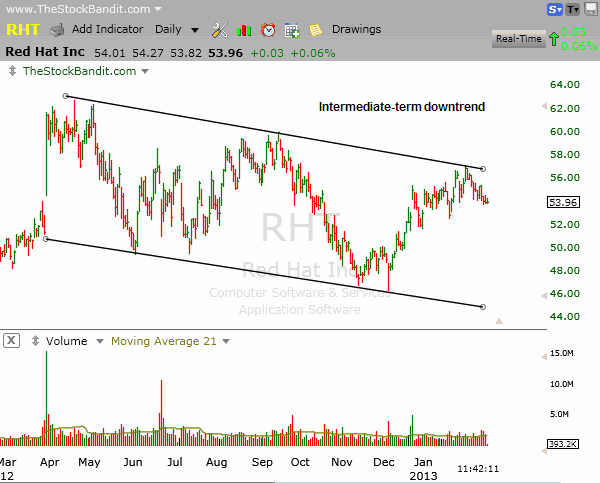
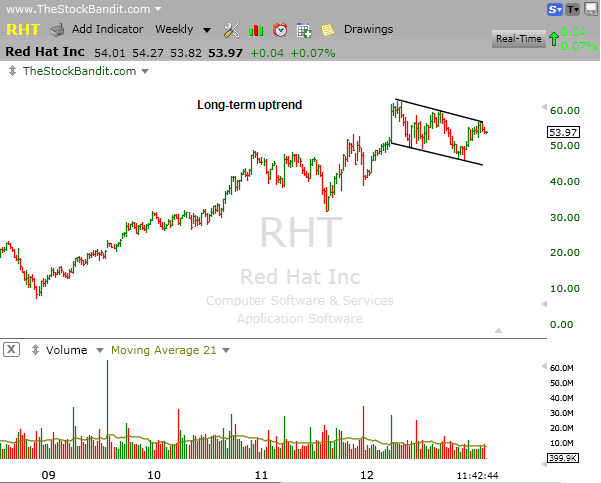
The RHT daily chart is caught in a downtrend channel over the past few months, yet zooming out on the chart reveals what looks to be a pullback within the context of an overall uptrend.
So…who’s right, the bulls or bears here?
Both of them can be, and that’s because your view on a chart and the way you respond to what you see should be a function of your timeframe.
Short-term traders should pay the most attention to the most recent price action, which reveals a bounce within a correction phase that’s been underway since last spring. Bounces within the channel have been getting sold, so the short side is the one that will pay best until that changes (break of upper trend line, currently near $57). Also note how choppy the bounces within the channel have been vs. the declines which have been far smoother.
This intermediate-term chart shows RHT working lower in a well-defined channel with bounces to the upper end being followed by smoother selloffs to lower lows.

Those with a longer-term view see this as a pullback within a longer-term uptrend, which could present another opportunity for upside once it gets resolved. Those with holding times of months or beyond can wait for a turn up out of this channel to indicate the potential for another leg higher as strength returns.
This long-term weekly chart of RHT shows the stock has produced a sizeable advance over the past few years with the price action of the past few months looking like merely a pullback within the longer-term trend. A turn up out of this channel would be needed to set this stock back on the course of higher prices, but it’s a real possibility.

Opinions are a dime a dozen, and that’s not what you need for your trading. Instead, first consider your timeframe and then seek to discover some if/then scenarios for taking action.
Successful trading isn’t about predicting what happens next, it’s about taking the right kinds of risk with your capital. That becomes far easier when you stay objective with the price action you’re seeing on your preferred timeframe.
Trade Like a Bandit!
Jeff White
Take a trial to our Stock Pick Service to get our trades.


