An uptrend occurs when a stock makes consecutive higher highs and higher lows, resulting in a price advance which trends higher. Each relative high is above the preceding high, and each relative low is higher than the preceding low. Uptrend lines gain more validity each time price touches but does not penetrate the uptrend line. An uptrend remains a trend until this series of higher highs and higher lows is broken. A downside penetration of a rising trend line is a technical sell signal, and usually the first indication that an uptrend may soon end. An uptrend is deemed to be complete with the formation of a lower high or a lower low.
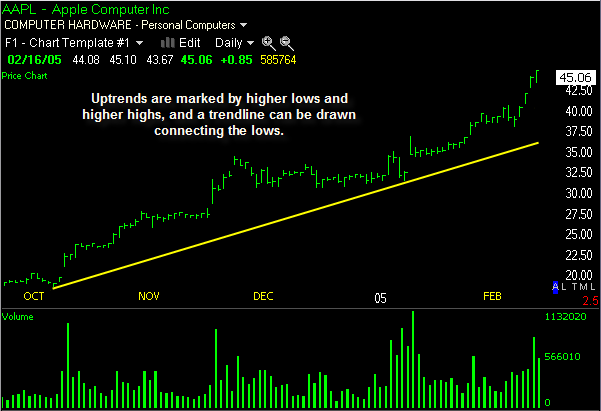
Example of a stock uptrend:

The chart above shows a stock in an uptrend. The trend line connects lows and matches the slope of the uptrend. Trend trading offers tremendous profit potential when a trend is identified correctly.
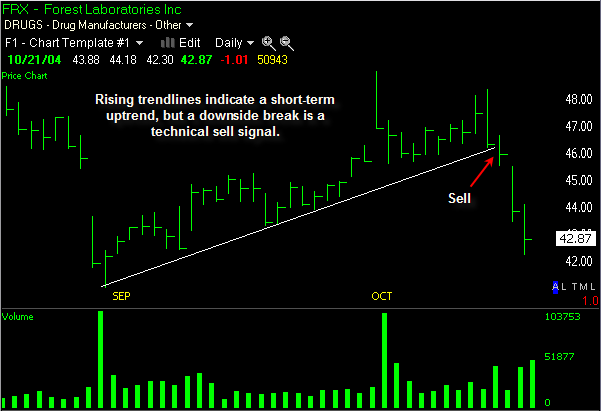
Example of an uptrend line:

An uptrend line connects lows during a stock uptrend, but the downside penetration of the uptrend line is a technical sell signal or short selling signal. The downside break of the trend line in this stock was the first indication that the trend was ending, and provided an excellent place to exit the trade.
Uptrend lines give us dynamic levels which are valid for support, at least until broken. We trade quite often using uptrend lines, and we share them regularly with members of our stock pick service. Come trade with us!
Be sure to learn more about trend lines as well as downtrends.


