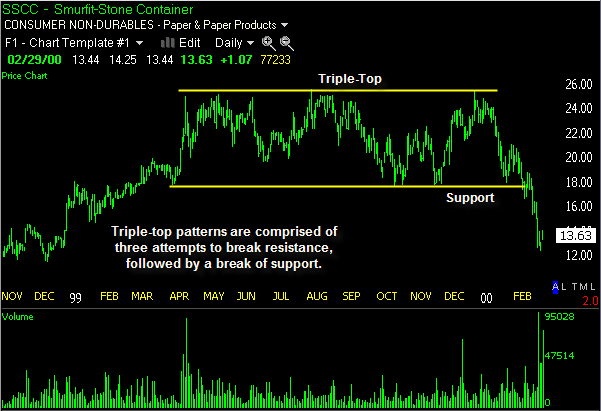
A triple top is a reversal pattern composed of three failed attempts at making new highs in the same area, followed by a subsequent downside break of support. This pattern is rare, but a very reliable sell signal.
Context: This pattern is generally found within high trading ranges following uptrends, and the break of support which confirms this pattern is what makes it a reversal pattern.
Appearance: Triple top patterns are found at the end of uptrends in stocks where price makes three attempts at making a new high. These attempts are spaced apart often by multiple weeks. The resistance area which price fails to penetrate does not have to be the same exact price, and multiple attempts to rally into the same area may be considered a potential triple top. During this time, a support level is established which forms a trading range between support and resistance. The downside break of this support confirms the triple top pattern, which is the technical sell signal.
Breakdown Expectation: Triple top breakdowns often will make a measured move lower. To determine the downside price projection from this pattern, measure the height of the trading range during the triple top pattern and subtract it from the support level once it is penetrated to the downside.

This stock formed a triple top pattern after a big price advance. Once price penetrated support to the downside, the stock moved considerably lower.
Be sure to learn about the triple bottom pattern.


