Last week stocks came off a late bounce from the prior week ahead of a D.C. debt deal, and kept going once the rumor became official. They went out on their highs of the rebound, adding to the quick gains off the October lows while shunning the notion that a sell-the-news response was in order. Each of them are extended and overdue a rest, but with the bulls running with momentum, we could still see dips get bought aggressively.
As we head into a new week of trading, it’s time once again to take a look at the indexes and the key levels they’re dealing with. This will impact how individual names move, so it’s where every new trading week begins.
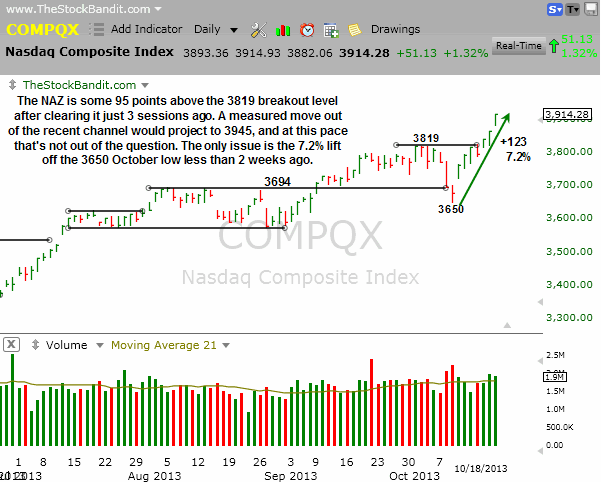
NAZ – The NAZ temporarily undercut support two weeks ago but abruptly reversed higher on hopes for a deal and continued past 3900 well after the news. This 7.2% lift leaves this index stretched but given its recent strength, it’s hard to say when a rest will arrive. We could see continuation toward 3945 for a measured move as explained on the chart, which isn’t far from current levels.
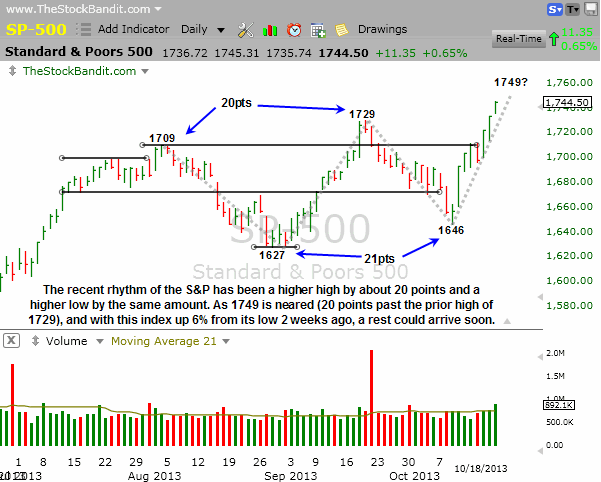
SP500 – The S&P saw a higher high last month by 20 points and a higher low earlier this month by 21 points. If that rhythm continues, we could see this index stretch toward the 1749 area, which is now just 5 points away. It’s been a big run off the lows of just 8 sessions ago with a 6% lift for the blue chips. Having just run 98 points, some digestion sooner than later would be healthy to see.
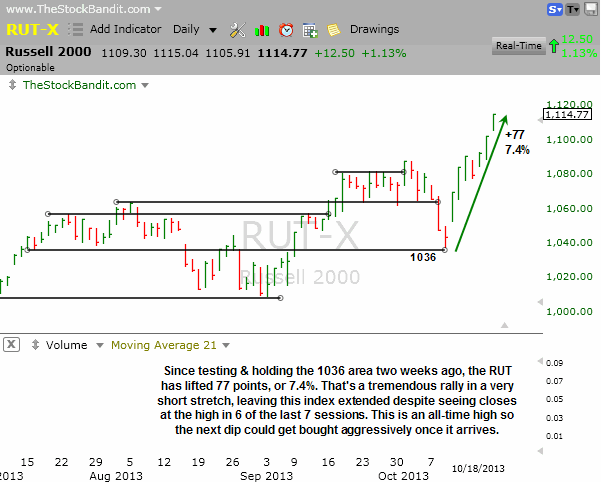
RUT – The RUT made a new all-time high last week as it ran to 1115, or 7.4% off its low from less than two weeks ago. That tested a key level, just as we’ve seen many other times with this index, but now it’s looking stretched here and due for some rest and digestion soon. Even some lateral price action would help to alleviate the overbought conditions as this pace simply isn’t sustainable.
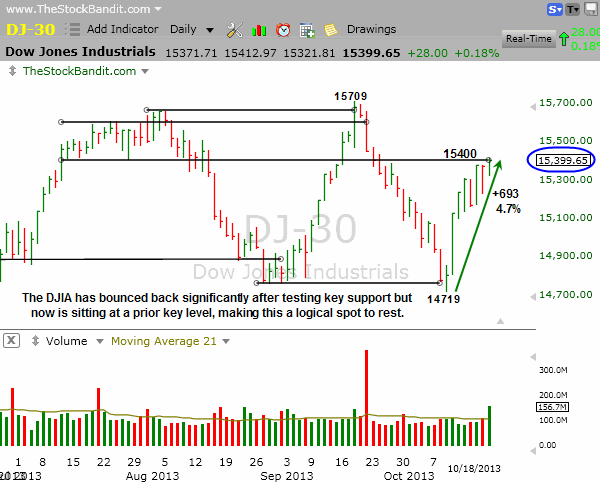
DJIA – The DJIA finished the week less than half a point from 15400, a level highlighted here multiple times as having been respected since this summer. This index is still 310 off its 2013 high, making it the laggard of the bunch, but it just bounced from a key level and then finished last week at another. Being only 30 stocks, it’s of less importance to me but still an index to keep an eye on as Main Street is most familiar with it.
Take a trial of the Stock Pick Service to get my trades.
Trade Like a Bandit!
Jeff White


