The Thanksgiving rally saw no follow through this past week as the indexes took a break. A highly-anticipated jobs number on Friday did produce a pop, but it wasn’t enough to overcome what had been given back the rest of the week, so ultimately each of the key indexes finished lower. The bulls point to mild profit-taking, while the bears are hoping it’s the beginning of the end (again). It should be fun to see it all play out.
One other note I’d like to point out right now is that it’s December, and as the month progresses there are always a few cross-currents which aren’t present the rest of the year. We have the usual window-dressing here at the end of the quarter, but beyond that are fund redemptions, index rebalancing, tax-related sales, all paired with some lighter holiday volume that’s sure to come. Keep that in mind the next few weeks and tread a little lighter than usual because of it.
This week I’m going to mix it up just a bit and look at 4 main index ETF’s. These of course resemble the key indexes, so taking note of the price action taking place there will also affect how individual stocks move.
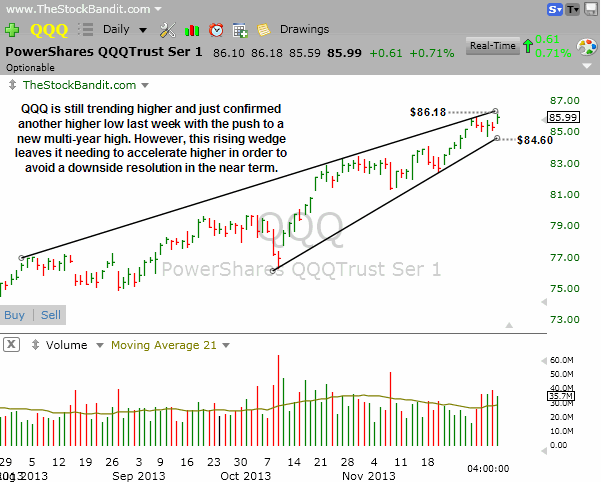
QQQ – The NAZ 100 ETF is still trending higher, and in fact just made a new multi-year high in Friday’s session. This daily chart does highlight a rising wedge pattern, and price is nearing the apex. These patterns often resolve lower as even a lateral move in price will bring a break of the lower trend line first. In order to negate this pattern, QQQ and the NAZ 100 will need to accelerate higher and actually break out above the upper trend line.
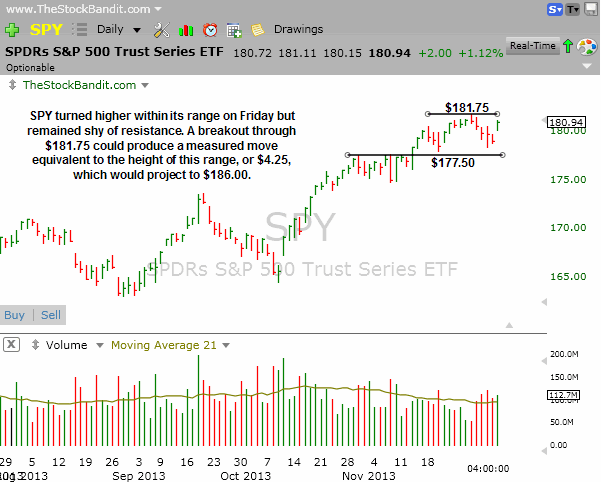
SPY – The S&P 500 ETF is sitting in a high-level channel as it bases and digests the rally off the October low. Price turned higher within the range on Friday and now isn’t far from upper resistance. A breakout through $181.75 could spark a measured move of $4.25 (height of the range), taking this ETF to the $186 area on the next move. Price needs to first clear the highs in order to set that move in motion.
IWM – The RUT 2000 ETF bounced Thursday and Friday, yet still finished some $1.66 below the recent high. That leaves it roughly 1.5% shy of the highs. There’s a lateral level that has been respected from both sides since October which stands at $111.50, and currently price is back above that level after multiple tests last week. Also note the higher lows in place over the past few weeks which point to ongoing buying of weakness.
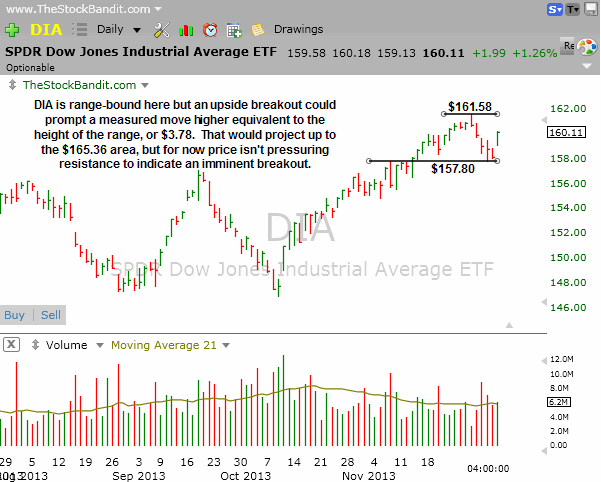
DIA – The DJIA ETF resembles the S&P as it sits in this high-level channel pattern digesting the rally off the October low. $161.58 is the current high, with support at $157.80 (former resistance). That makes a $3.78 trading range, which could eventually produce a measured move if price breaks out to the upside. For now, there’s room on both sides of price before either boundary would be threatened, so more time may be needed before we see a decisive exit from this range.
Take a trial of the Stock Pick Service to get my trades.
Trade Like a Bandit!
Jeff White


