TheStockBandit.com

Swing Trading and momentum investing stock pick newsletter and swing trading service.

  • Home
    • Blog Archives
    • Blog Categories
  • About
    • About The Stock Bandit
    • FAQ
    • Contact Us
  • Strategy
    • Join the Email List!
    • Stock Trading Methodology
    • Trading Rules
    • Chart Patterns
  • Products
    • Products Overview
    • Trading Courses
    • Stock Pick Service
    • Recent Trades
    • Trader Coaching
    • Seminar DVD’s
  • Subscription Info

Review of the Indexes 12-15-2013

December 15, 2013 By Jeff White Filed Under: Index Charts

Stocks stumbled last week with the bounce from the prior week quickly getting sold.  The failure created a lower high for the S&P 500, the DJIA, and the RUT, turning the short-term direction downward.  Across the board, we saw declines of 1.5 to 2.1%, which was certainly a change of pace for this market after such persistent strength.

As we head into a new week of trading, it’s time once again to take a look at the indexes and the key levels they’re dealing with. This will impact how individual names move, so it’s where every new trading week begins.

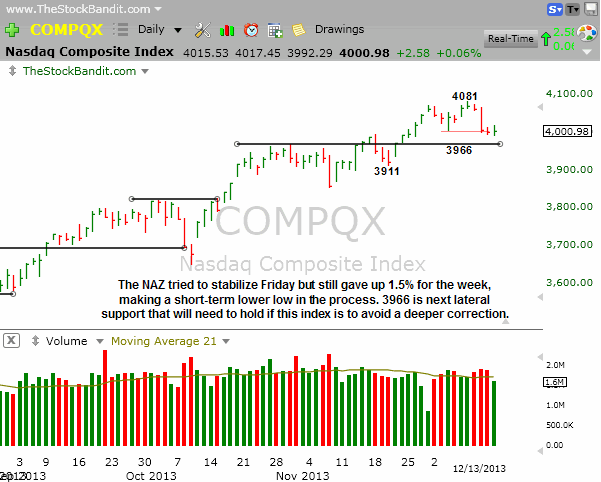
NAZ – The NAZ gave up 61 points last week with a feeble Monday lift to new multi-year highs followed by heavy price action into the remainder of the week.  It established a lower short-term low (red line) as it broke below 4004 from early this month and ultimately finished right at 4000.  Next level to watch is 3966 from October, as a break below that could see profit-taking accelerate.

NAZ-12-15-2013

Why I Use TC2000


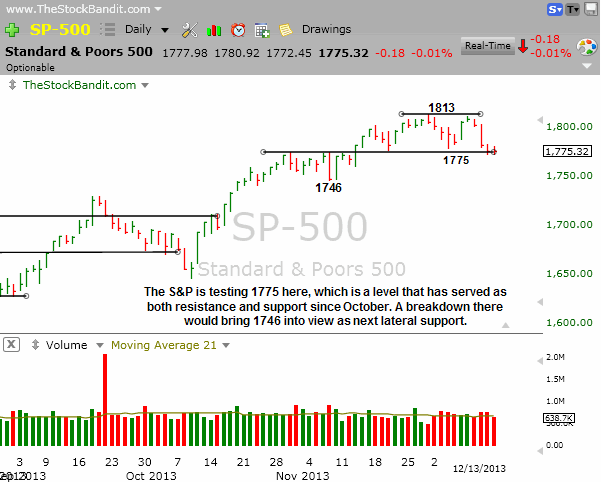
SP500 – The S&P saw a minor advance last Monday which stopped shy of the 1813 high to make a lower high, then rolled over hard to test the 1775 area where it ultimately finished the week.  This has been a big level going back to October as we’ve seen it serve as both resistance and support in Q4.  A downside break would open the door to 1746 as next lateral support.

SP500-12-15-2013

Why I Use TC2000


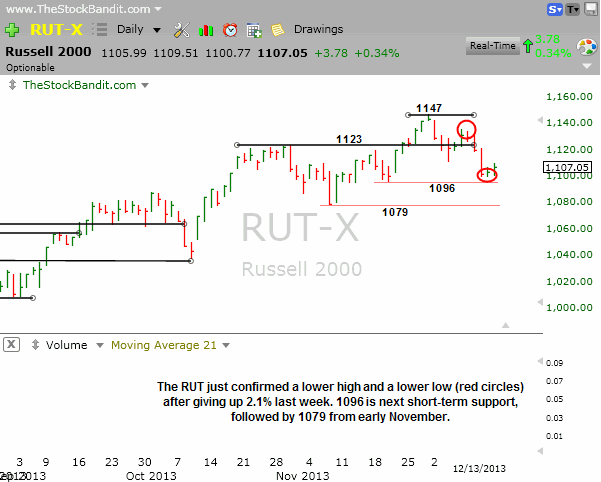
RUT – The RUT led the way lower last week as cash got raised aggressively in small-caps.  That brought a lower high and a lower low with a 2.1% decline in this index.  It’s now 40 points off its recent high, and just a short distance from the next lateral level of 1096 where support was found in mid-November.  The late-week bounce wasn’t impressive, and I’d expect to see 1123 serve as resistance now that we’ve seen such a decisive break below that level.

RUT-12-15-2013

Why I Use TC2000


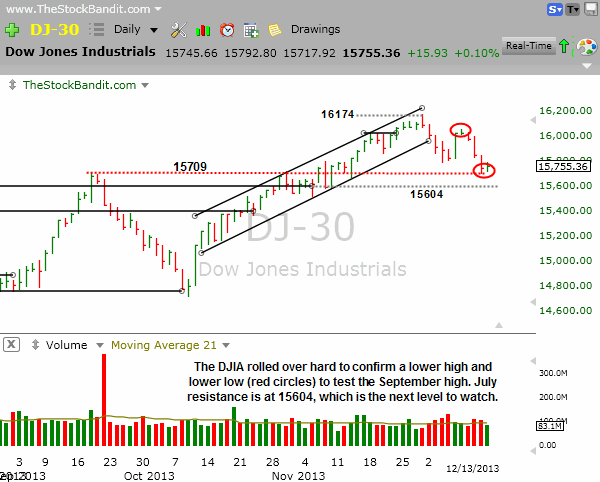
DJIA – The DJIA shed 264 points last week as a poor finish to Monday’s advance segued into a hard selloff mid-week.  That brought about a test of the September high and now leaves this index with both a lower high and a lower low.  Upside has been rare over the last couple of weeks, with the jobs report rally the prior Friday standing out like a sore thumb in what has otherwise been persistent weakness.

DJIA-12-15-2013

Why I Use TC2000


Take a trial of the Stock Pick Service to get my trades.

Trade Like a Bandit!

Jeff White

Follow @TheStockBandit

Review of the Index ETF’s 12-8-2013

December 8, 2013 By Jeff White Filed Under: Index Charts

The Thanksgiving rally saw no follow through this past week as the indexes took a break.  A highly-anticipated jobs number on Friday did produce a pop, but it wasn’t enough to overcome what had been given back the rest of the week, so ultimately each of the key indexes finished lower.  The bulls point to mild profit-taking, while the bears are hoping it’s the beginning of the end (again).  It should be fun to see it all play out.

One other note I’d like to point out right now is that it’s December, and as the month progresses there are always a few cross-currents which aren’t present the rest of the year.  We have the usual window-dressing here at the end of the quarter, but beyond that are fund redemptions, index rebalancing, tax-related sales, all paired with some lighter holiday volume that’s sure to come.  Keep that in mind the next few weeks and tread a little lighter than usual because of it.

This week I’m going to mix it up just a bit and look at 4 main index ETF’s.  These of course resemble the key indexes, so taking note of the price action taking place there will also affect how individual stocks move.

QQQ – The NAZ 100 ETF is still trending higher, and in fact just made a new multi-year high in Friday’s session.  This daily chart does highlight a rising wedge pattern, and price is nearing the apex.  These patterns often resolve lower as even a lateral move in price will bring a break of the lower trend line first.  In order to negate this pattern, QQQ and the NAZ 100 will need to accelerate higher and actually break out above the upper trend line.

QQQ-12082013

Why I Use TC2000


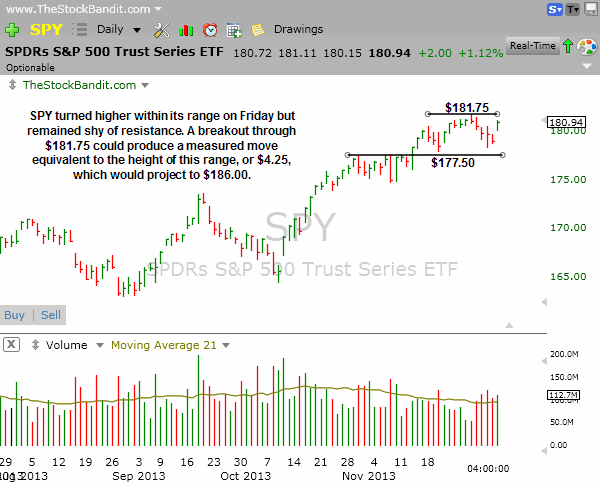
SPY – The S&P 500 ETF is sitting in a high-level channel as it bases and digests the rally off the October low.  Price turned higher within the range on Friday and now isn’t far from upper resistance.  A breakout through $181.75 could spark a measured move of $4.25 (height of the range), taking this ETF to the $186 area on the next move.  Price needs to first clear the highs in order to set that move in motion.

SPY-12082013

Why I Use TC2000


IWM – The RUT 2000 ETF bounced Thursday and Friday, yet still finished some $1.66 below the recent high.  That leaves it roughly 1.5% shy of the highs.  There’s a lateral level that has been respected from both sides since October which stands at $111.50, and currently price is back above that level after multiple tests last week.  Also note the higher lows in place over the past few weeks which point to ongoing buying of weakness.

IWM-12082013

Why I Use TC2000


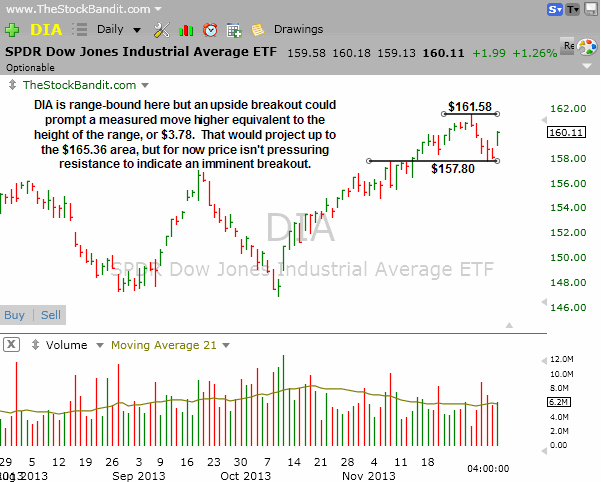
DIA – The DJIA ETF resembles the S&P as it sits in this high-level channel pattern digesting the rally off the October low.  $161.58 is the current high, with support at $157.80 (former resistance).  That makes a $3.78 trading range, which could eventually produce a measured move if price breaks out to the upside.  For now, there’s room on both sides of price before either boundary would be threatened, so more time may be needed before we see a decisive exit from this range.

DIA-12082013

Why I Use TC2000


Take a trial of the Stock Pick Service to get my trades.

Trade Like a Bandit!

Jeff White

Follow @TheStockBandit

Review of the Indexes 12-1-2013

December 1, 2013 By Jeff White Filed Under: Index Charts

A holiday-shortened week and light Thanksgiving volume didn’t stop the market last week from making some progress as the NAZ pushed further beyond 4000 to cap off a 6-session win streak while the RUT, S&P 500 and DJIA each reached new all-time highs.

As we head into a new week of trading, it’s time once again to take a look at the indexes and the key levels they’re dealing with. This will impact how individual names move, so it’s where every new trading week begins.

NAZ – The NAZ has posted 6 straight advances, leaving it well past 4000.  Perhaps more importantly, it has some 148 points down to the last minor pullback low, giving it lots of room to create another higher low on any dip from here.

NAZ-12-1-2013

Why I Use TC2000


SP500 – The S&P is holding steady just above 1800, but the pace has slowed a bit and now a rising wedge is starting to emerge on the daily chart.  That isn’t necessarily bad news, as an upside resolution would negate this, but it’s something to keep an eye on.  1775 has proven to be a key level in recent weeks as both resistance and support, making it the first downside level to watch if some selling kicks in.

SP500-12-1-2013

Why I Use TC2000


RUT – The RUT hesitated around 1123 but then accelerated some last week to create some separation.  Friday’s finish was poor, but it’s been a quick run since 1096 and a little rest may be in order.

RUT-12-1-2013

Why I Use TC2000


DJIA – The DJIA is still firmly within its uptrend channel here.  On Friday, it got within 26 points of 16200, then backed off into the close.  There’s still no negative change of character here though, so the channel remains in effect until proven otherwise.  Watch the channel lines around 16220 and 15950, both of which rise slightly each day.

DJIA-12-1-2013

Why I Use TC2000


Take a trial of the Stock Pick Service to get my trades.

Trade Like a Bandit!

Jeff White

Follow @TheStockBandit

Review of the Indexes 11-24-2013

November 24, 2013 By Jeff White Filed Under: Index Charts

A 3-day pullback to kick off last week left bulls itching to put cash to work, and that’s just what they did.  By the close on Friday, the RUT, S&P 500 and DJIA had each broken out to new all-time highs.  That keeps the pressure on bears as we head into a holiday-shortened week of trading (which frequently has a bullish slant), and the question remains whether this is the year-end melt-up or simply the start of one.

As we head into a new week of trading, it’s time once again to take a look at the indexes and the key levels they’re dealing with. This will impact how individual names move, so it’s where every new trading week begins.

NAZ – The NAZ gave up 3966 last week, the prior breakout zone, then quickly reclaimed it to finish just 4 points off its multi-year high.  Following several weeks of basing activity, this index may be poised for another big run despite the lack of profit-taking we’ve seen since early October.

NAZ-11-24-2013

Why I Use TC2000


SP500 – The S&P has added 9.6% since the low on October 9th, making this one very impressive run for the blue chips.  We’ve recently seen a little rest, but virtually no profit-taking, and that leaves this index with a bit of a stretched appearance.  However, last week we saw 1775 validated via a pullback test, followed by the creation of a new all-time high.  The trend is up, it’s just wise to trail stops along the way when the air starts to get thinner.

SP500-11-24-2013

Why I Use TC2000


RUT – The RUT had led the way higher for the past year of this rally, but in recent weeks it has stalled out.  There was a potential lower high in play as recently as last Monday (1119 vs. 1123), but that scenario was eliminated with the creation of a new all-time high on Friday as the small caps pushed through resistance.  This breakout is for now only incremental, but it’s a step in the right direction for the bulls who seem to have no plans as of yet to leave the party.

RUT-11-24-2013

Why I Use TC2000


DJIA – The DJIA just keeps grinding higher since its false breakdown on October 9th, adding some 1345 points since that day of just over 6 weeks ago.  It just painted a new all-time high with Friday’s advance, keeping it firmly within its uptrend channel.  Until that changes, there’s no reason to expect anything different but brief, shallow dips on occasion with otherwise steady strength.  A shake-up will eventually come, but technically there’s no indication it’s imminent.

DJIA-11-24-2013

Why I Use TC2000


Take a trial of the Stock Pick Service to get my trades.

Trade Like a Bandit!

Jeff White

Follow @TheStockBandit

Review of the Indexes 11-10-2013

November 10, 2013 By Jeff White Filed Under: Index Charts

What had been a quiet week became turbulent on Thursday with nasty selloffs across the board. However, stocks recovered immediately with a snapback rally on Friday which erased the Thursday decline, in some cases almost to the penny.  That leaves the major averages range-bound, but gives traders a reminder that anything’s possible in either direction here.

As we head into a new week of trading, it’s time once again to take a look at the indexes and the key levels they’re dealing with. This will impact how individual names move, so it’s where every new trading week begins.

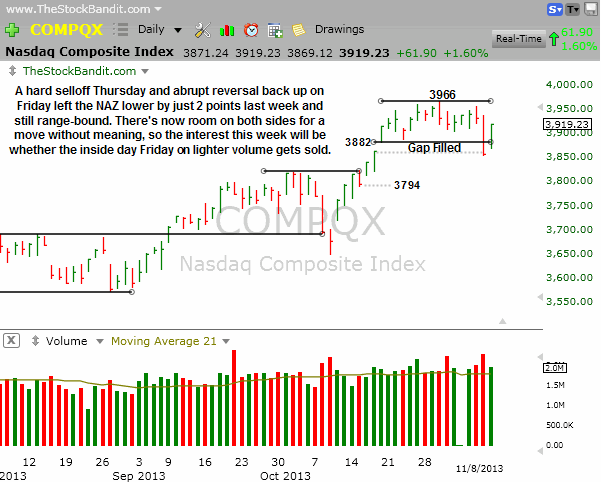
NAZ – The NAZ broke support to fill a gap from October, then lifted big on Friday to finish back inside the range.  This makes for sloppy trading in the short term, but continued basing action has now fully digested the October rally, which badly needed to happen. 3966 is the number to watch on the upside, while 3855 is Thursday’s low to keep on the radar.  A downside break could bring the next unfilled gap to 3794 into the picture.

NAZ-11-10-2013

Why I Use TC2000


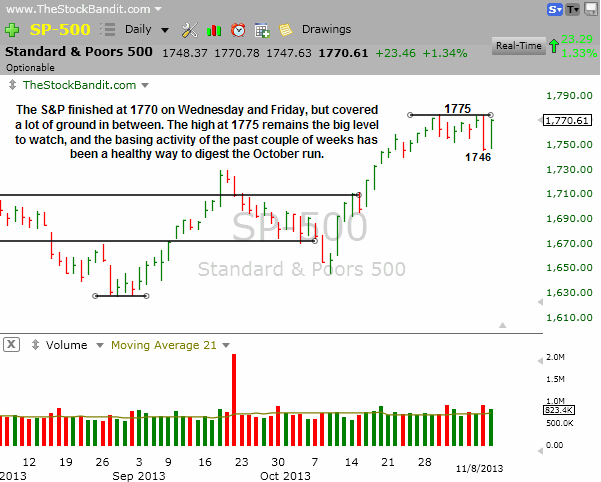
SP500 – The S&P fell apart on Thursday, only to recover the same amount (23 points) on Friday to finish at 1770, Wednesday’s closing level. It’s once again within just a few points of new-high territory, with 1775 being the number to watch on the way up.  Beyond that, it’s blue sky for this index, but the bulls will need to give it a nudge to exit this high-level consolidation zone.

SP500-11-10-2013

Why I Use TC2000


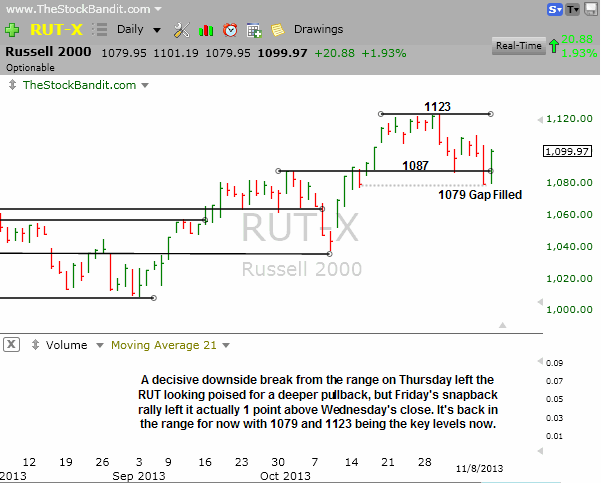
RUT – The RUT looked poised for a much deeper retracement after Thursday’s break of 1087 support and gap fill to 1079 from October to post its 6th decline in 7 sessions.  But with Friday’s arrival came a surprise move right back up to finish 1 point above Wednesday’s close of 1098.  It’s now back inside the range with room to move higher or lower to some extent before something technically meaningful happens.

RUT-11-10-2013

Why I Use TC2000


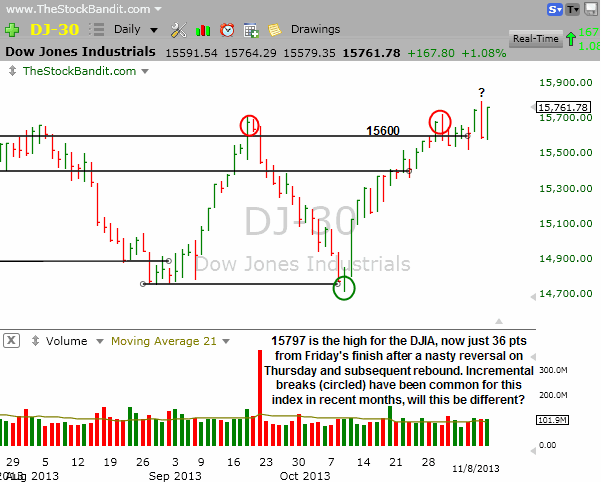
DJIA – The DJIA has tagged 15600 in almost every session for the past 2 weeks.  Incremental new highs/lows have plagued this senior index with subsequent reversals, so last Wednesday’s new incremental high looked poised to follow the same playbook when Thursday’s bearish engulfing bar got painted.  However, Friday’s rally left this index shy of its intraday high but sitting at a new all-time closing high.  The door is open for more upside, but for it to stick in this index we’ll likely need to see some of the others achieve a similar feat (S&P).

DJIA-11-10-2013

Why I Use TC2000


Take a trial of the Stock Pick Service to get my trades.

Trade Like a Bandit!

Jeff White

Follow @TheStockBandit

Review of the Indexes 11-3-2013

November 1, 2013 By Jeff White Filed Under: Index Charts

Last week we saw some new all-time highs created in 3 of the 4 indexes I track, but after that took place, the averages seemed to go their own directions.  Small-caps pulled back hard, while the blue chips held their ground.  Was it simply healthy rotation, or are small-caps sending a signal?

As we head into a new week of trading, it’s time once again to take a look at the indexes and the key levels they’re dealing with. This will impact how individual names move, so it’s where every new trading week begins.

NAZ – The NAZ is carving out a bit of a channel here as it respects the high as well as the closing low of the last couple of weeks.  This lateral price action can of course make for some choppy days, but it’s been long overdue and it’s finally here, allowing more individual names to base as well.

NAZ-1103-2013

Why I Use TC2000


SP500 – The S&P saw a minor retreat off its high from Wednesday, but overall this index remains very strong and technically in great shape.  Should some selling kick in, there’s an unfilled gap to 1733.  Otherwise, the current high at 1775 is the level to watch on the upside.

SP500-1103-2013

Why I Use TC2000


RUT – The RUT saw a hard selloff after setting an incremental new high on Wednesday at 1123.  It pulled back all the way to 1087 on Friday before bouncing from the same level it peaked at back on Oct 1.  Should 1087 happen to get broken, there’s an unfilled gap down to 1079.  The last 3-day dip in this index was in early October and led to a giant rally.  Traders won’t quickly forget that as we look at the current dip.  Those calling for a top will want to see a bounce fail somewhere beneath 1123.

RUT-1103-2013

Why I Use TC2000


DJIA – The DJIA made an incremental new all-time high on Wednesday, then pulled back and is now hovering near 15600 – a level it has respected on numerous occasions in recent months.  Having just run over 1000 points higher from the October 9th low, this index is entitled to a rest.  Bulls just won’t want to see it spend too much time beneath the highs or talk could soon surface of a double-top.  Interestingly, the prior high from September was also an incremental breakout which promptly failed, so we’ll see if the breakout last week has a different fate.

DJIA-1103-2013

Why I Use TC2000


Take a trial of the Stock Pick Service to get my trades.

Trade Like a Bandit!

Jeff White
Follow @TheStockBandit

Review of the Indexes 10-27-2013

October 25, 2013 By Jeff White Filed Under: Index Charts

Last week we saw each of the major averages able to post gains, although the pace slowed noticeably as the current lift from the Oct. 9 low grew long in the tooth.  There was a little bit of hesitation and some strength was faded, but the bulls were able to make new multi-year or all-time highs for the NAZ, S&P 500, and RUT.  They might be slowing down a bit, but the bulls still maintain the technical & psychological edge for now.

As we head into a new week of trading, it’s time once again to take a look at the indexes and the key levels they’re dealing with. This will impact how individual names move, so it’s where every new trading week begins.

NAZ – The NAZ saw upside opening gaps get filled on 3 days last week, showing that there is at least some desire right now to lighten up into strength.  However, it gained more ground on the week, adding 29 from the prior week.  There are a pair of unfilled gaps down below which could get targeted on any weakness.  On the upside, this index is now just 1% away from 4000.

NAZ-10-27-2013

Why I Use TC2000


SP500 – The S&P challenged 1759 a pair of times last week after a Wed/Thu pause, and added 15 points on the week.  The prior high was 1729 and there’s an unfilled gap to 1733, both of which are levels to watch should we happen to see some selling.  The short-term, intermediate-term, and long-term trends all remain up.

SP500-10-27-2013

Why I Use TC2000


RUT – The RUT reached for another new all-time high last week at 1121, but twice was unable to close above it.  This index only added 3 points on the week, so it was finally able to put in some lateral rest.  Should some selling arrive, I’ll be watching 1102 and 1079 as unfilled gaps on the downside which could be eventually tested on a pullback.

RUT-10-27-2013

Why I Use TC2000


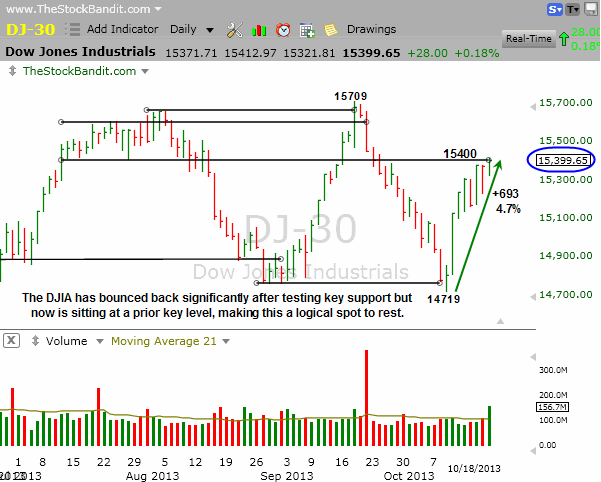
DJIA – The DJIA tacked on 153 for the week and was able to put 15400 in its rearview mirror for the time being.  Next levels to watch on the upside are 15600 (July resistance) and 15709, the all-time high.

DJIA-10-27-2013

Why I Use TC2000


Take a trial of the Stock Pick Service to get my trades.

Trade Like a Bandit!

Jeff White
Follow @TheStockBandit

Review of the Indexes 10-20-2013

October 20, 2013 By Jeff White Filed Under: Index Charts

Last week stocks came off a late bounce from the prior week ahead of a D.C. debt deal, and kept going once the rumor became official.  They went out on their highs of the rebound, adding to the quick gains off the October lows while shunning the notion that a sell-the-news response was in order.  Each of them are extended and overdue a rest, but with the bulls running with momentum, we could still see dips get bought aggressively.

As we head into a new week of trading, it’s time once again to take a look at the indexes and the key levels they’re dealing with. This will impact how individual names move, so it’s where every new trading week begins.

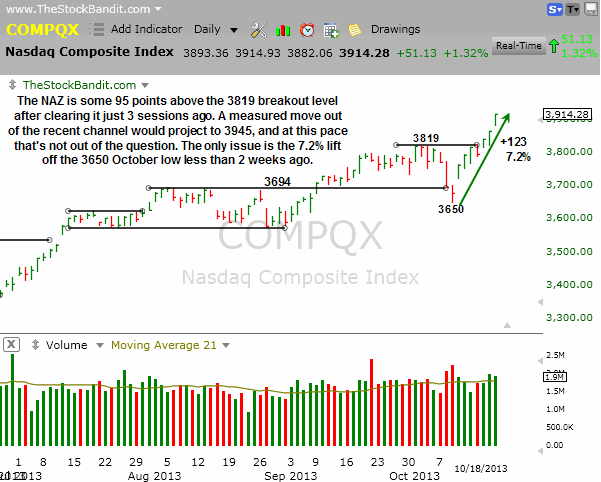
NAZ – The NAZ temporarily undercut support two weeks ago but abruptly reversed higher on hopes for a deal and continued past 3900 well after the news. This 7.2% lift leaves this index stretched but given its recent strength, it’s hard to say when a rest will arrive. We could see continuation toward 3945 for a measured move as explained on the chart, which isn’t far from current levels.

NAZ-10-20-2013

Why I Use TC2000


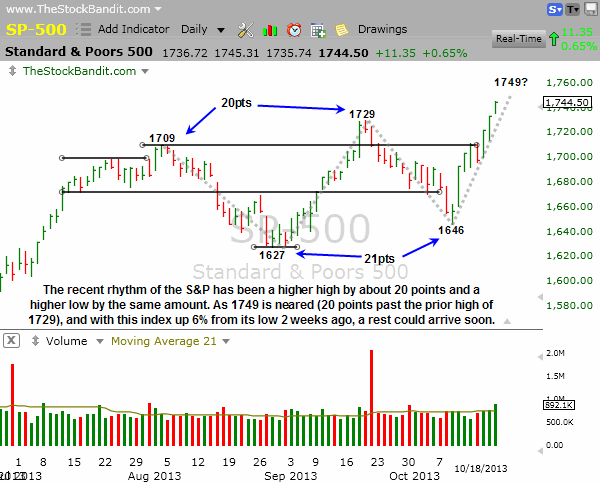
SP500 – The S&P saw a higher high last month by 20 points and a higher low earlier this month by 21 points. If that rhythm continues, we could see this index stretch toward the 1749 area, which is now just 5 points away. It’s been a big run off the lows of just 8 sessions ago with a 6% lift for the blue chips. Having just run 98 points, some digestion sooner than later would be healthy to see.

SP500-10-20-2013

Why I Use TC2000


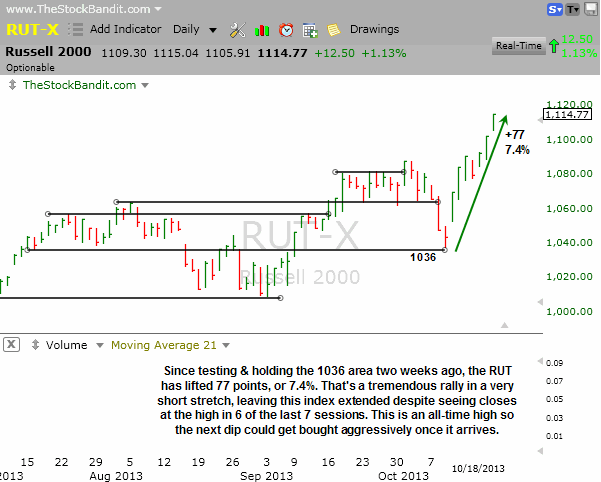
RUT – The RUT made a new all-time high last week as it ran to 1115, or 7.4% off its low from less than two weeks ago. That tested a key level, just as we’ve seen many other times with this index, but now it’s looking stretched here and due for some rest and digestion soon.  Even some lateral price action would help to alleviate the overbought conditions as this pace simply isn’t sustainable.

RUT-10-20-2013

Why I Use TC2000


DJIA – The DJIA finished the week less than half a point from 15400, a level highlighted here multiple times as having been respected since this summer. This index is still 310 off its 2013 high, making it the laggard of the bunch, but it just bounced from a key level and then finished last week at another.  Being only 30 stocks, it’s of less importance to me but still an index to keep an eye on as Main Street is most familiar with it.

DJIA-10-20-2013

Why I Use TC2000


Take a trial of the Stock Pick Service to get my trades.

Trade Like a Bandit!

Jeff White
Follow @TheStockBandit

Review of the Indexes 10-13-2013

October 13, 2013 By Jeff White Filed Under: Index Charts

Last week we saw continued deterioration off the recent highs as the major averages slid lower on fears of a US debt default. Although no deal is yet in place, the market responded in hopes that a default could be avoided and prices spiked higher from their lows on Wednesday in violent fashion.  One has to wonder what happens once a deal actually gets announced, and whether prices are now poised for a sell-the-news reaction.

As we head into a new week of trading, it’s time once again to take a look at the indexes and the key levels they’re dealing with. This will impact how individual names move, so it’s where every new trading week begins.

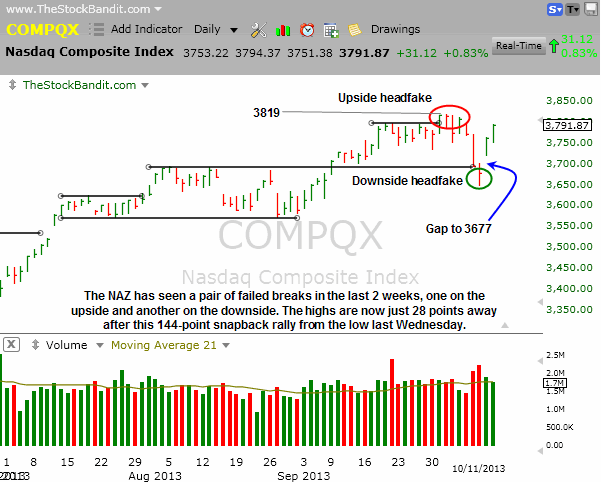
NAZ – The NAZ has seen a pair of headfakes in the last 2 weeks:  one to the upside, and one to the downside. As the new trading week begins, this index sits some 28 points from its high but 141 points off its low from last week with a sizeable unfilled gap.

NAZ-10-13-2013

Why I Use TC2000


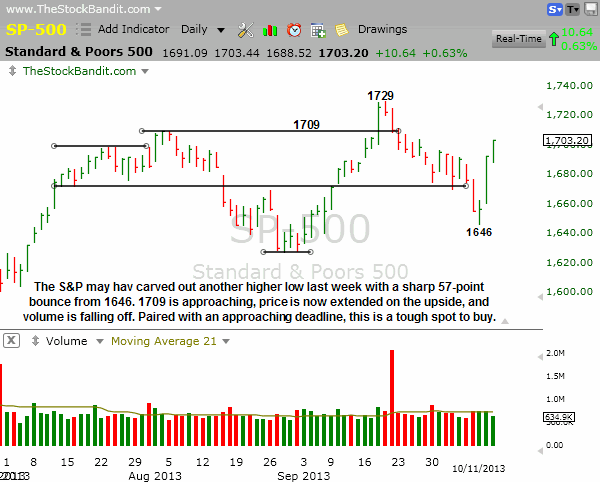
SP500 – The S&P vaulted higher by 57 points from the low on Wednesday to Friday’s closing bell.  That put an end to the persistent weakness we’ve seen, and may have carved out a higher low in the process.  Prior resistance at 1709 and 1729 are still overhead.

SP500-10-13-2013

Why I Use TC2000


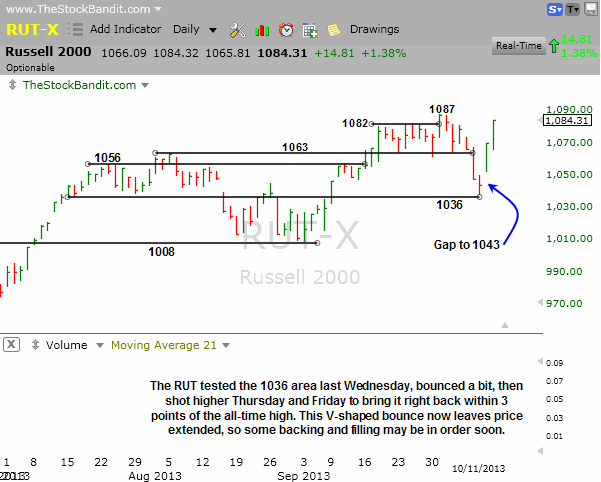
RUT – The RUT spiked by 47 points from its low on Wednesday into Friday’s close, leaving the small-cap index just 3 points from its all-time high.  An unfilled gap is on the chart to the 1043 level, but it will be most interesting how this index gets treated as the highs are tested.

RUT-10-13-2013

Why I Use TC2000


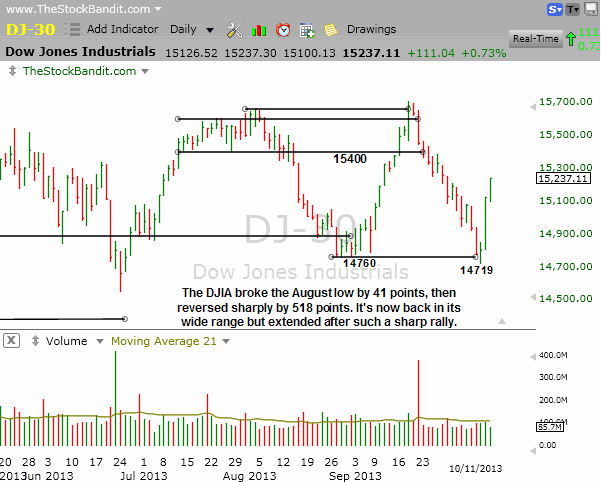
DJIA – The DJIA had been the picture of a steady slide until last week when it incrementally broke the August low then vaulted 518 points into Friday’s closing bell.  This index is now in no man’s land as there isn’t a level anywhere near current prices.  On the way up is 15400, whereas the 14700 area has just held as support twice.

DJIA-10-13-2013

Why I Use TC2000


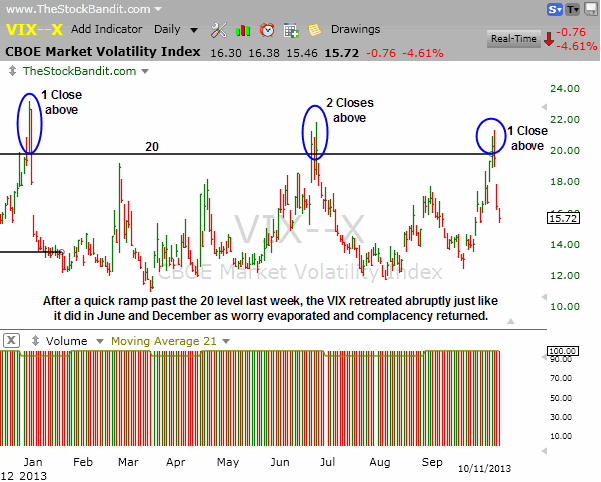
VIX – The VIX maintained its habit of only being able to hold above 20 for a very brief time last week as it chalked up a single close beyond that level before tanking back into the range, just like it did last December and then again in June.  Fear subsided quickly, but a US debt default could change that again quickly, so this is an index to keep on the radar this week.

VIX-10-13-2013

Why I Use TC2000


Take a trial of the Stock Pick Service to get my trades.

Trade Like a Bandit!

Jeff White
Follow @TheStockBandit

Video Review of the Indexes 10-6-2013

October 6, 2013 By Jeff White Filed Under: Index Charts

The market largely shook off the government shutdown last week, but the picture remained mixed.  There’s a silver lining for the underperformance of the senior indexes (DJIA and S&P 500), which I’ll cover in the video.

As we head into a new week of trading, it’s time once again to take a look at the indexes and the key levels they’re dealing with. This will impact how individual names move, so it’s where every new trading week begins.

Hit the gear icon on the player to select HD and then go full-screen for best quality.

Run time is 7:12.

Trade Like a Bandit!

Jeff White

Take a trial to my Stock Pick Service to get my trades.

Follow @TheStockBandit

  • « Previous Page
  • 1
  • 2
  • 3
  • 4
  • 5
  • …
  • 8
  • Next Page »

Member Login

Become a Member Now
Lost Password


Recommended Broker


Links & Archives

Trading Blog Archives
Join the Email List
About Jeff White
Stock Trading Courses
Testimonials
Recent Performance

Post Categories

Stock Charts Posts
Q&A Posts
Index Charts Posts
Trader Improvement
General Blog Posts

Links

Terms of Service
Privacy Policy
Disclaimer
Site Map
Contact us

Follow


Premium Services

Stock Pick Service
Trading Courses
Trader Coaching

Copyright © 2025 TheStockBandit, Inc. · All Rights Reserved