TheStockBandit.com

Swing Trading and momentum investing stock pick newsletter and swing trading service.

  • Home
    • Blog Archives
    • Blog Categories
  • About
    • About The Stock Bandit
    • FAQ
    • Contact Us
  • Strategy
    • Join the Email List!
    • Stock Trading Methodology
    • Trading Rules
    • Chart Patterns
  • Products
    • Products Overview
    • Trading Courses
    • Stock Pick Service
    • Recent Trades
    • Trader Coaching
    • Seminar DVD’s
  • Subscription Info

Video Review of the Indexes 7-14-2013

July 14, 2013 By Jeff White Filed Under: Index Charts

Stocks continued their torrid pace last week with a continuation of the bounce from the low set 3 weeks ago.  The pace is a bit too hot as some technical resistance approaches, setting the stage for a possible rest soon.

As we head into a new week of trading, it’s time once again to take a look at the indexes and the key levels they’re dealing with. This will impact how individual names move, so it’s where every new trading week begins.

Hit the gear icon on the player to select HD and then go full-screen for best quality.

Run time is 7:31.

Trade Like a Bandit!

Jeff White
Take a trial to our Stock Pick Service to get our trades.

Follow @TheStockBandit

Video Review of the Indexes 6-30-2013

June 28, 2013 By Jeff White Filed Under: Index Charts

Stocks rebounded last week after a poor Monday, but mostly by way of upside gaps.  By Friday, the strength had fizzled out and a stumble into the closing bell gave the market a tired look – and potentially another lower high.

As we head into a new week of trading, it’s time once again to take a look at the indexes and the key levels they’re dealing with. This will impact how individual names move, so it’s where every new trading week begins.

Hit the gear icon on the player to select HD and then go full-screen for best quality.

Run time is 8:39.

Trade Like a Bandit!

Jeff White
Take a trial to our Stock Pick Service to get our trades.

Follow @TheStockBandit

Review of the Indexes 6-23-2013

June 23, 2013 By Jeff White Filed Under: Index Charts

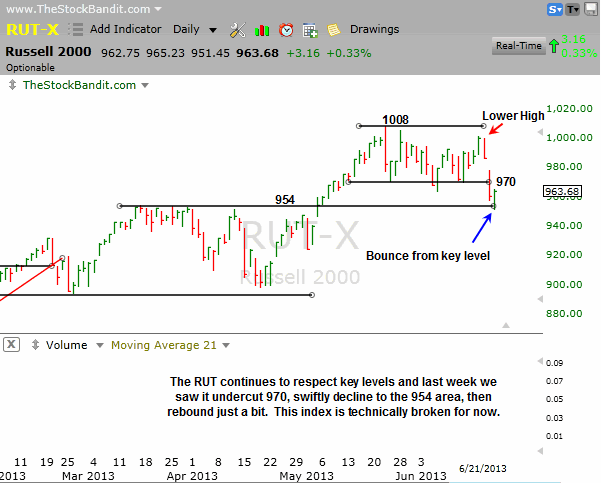
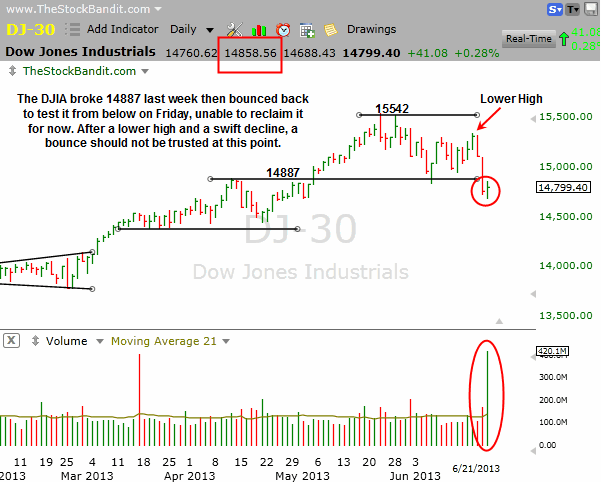
The lower high I discussed in the index review two weeks ago was confirmed last week as post-FOMC selling pressure left the indexes undercutting support zones in a swift decline.  We’ve been cautious and biased to the short side lately inside the member area, and that has served us well.  Now, we need to wait for a bounce back to reload shorts, as trapped bulls will very likely be using any strength from here to raise cash.

As we head into a new week of trading, it’s time once again to take a look at the indexes and the key levels they’re dealing with. This will impact how individual names move, so it’s where every new trading week begins.

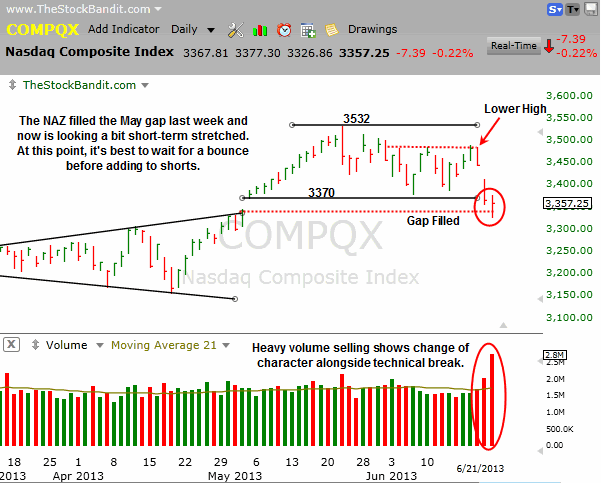
NAZ – The NAZ broke 3370 on Friday, filled the May gap, and then attempted to rebound from its lows after becoming short-term stretched yet was unable to go green on the session.  The gap fill completed some unfinished business for this index, and now it’s just a matter of how far the initial bounce carries.  Any stalled-out price action will likely invite more selling, reminding those who haven’t raised cash yet that it’s not too late.  Just look back 2 years for a reminder of how quickly a market can crumble.

NAZ-06232013

Why I Use TC2000


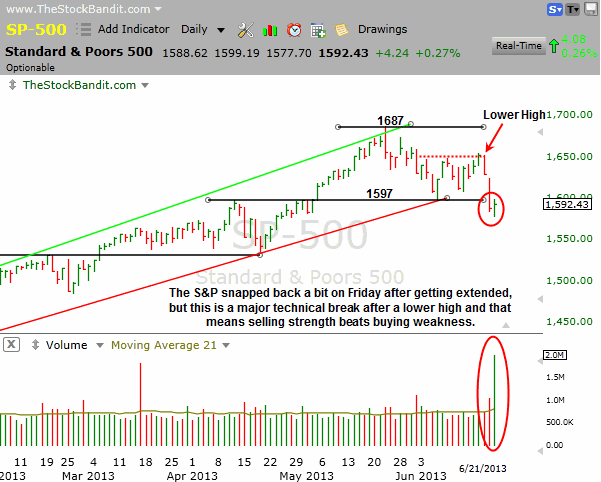
SP500 – The S&P broke below its uptrend channel and lateral support at 1597 to test some late-April support at 1577 before rebounding a bit on Friday afternoon.  Interestingly, it couldn’t reclaim the 1597 level on a closing basis Friday after lifting just beyond that level in the final hour of trading.  This is a major technical break and should not be viewed at this point as any old dip to buy.  It just confirmed a lower high and that should not be taken lightly.

SP500-06232013

Why I Use TC2000


RUT – The RUT undercut 970 last week and retreated immediately to the 954 area I’ve highlighted here numerous times.  It was able to bounce back a bit on Friday, but isn’t trustworthy after this hard breakdown.  Next level to watch is the unfilled gap to the 940 area from the close on May 2nd.

RUT-06232013

Why I Use TC2000


DJIA – The DJIA rebounded last week to test the 15300 area, but couldn’t hold it and quickly sold off hard.  The subsequent break of 14887 was met with an additional decline to 14688 before a Friday afternoon bounce took it back up toward broken support where it currently stands.  This index just confirmed a lower high (15340 vs. 15542) so the current bounce may not last long beyond the initial snap back.

DJIA-06232013

Why I Use TC2000


Take a trial to our Stock Pick Service to get our trades.

Trade Like a Bandit!

Jeff White

Follow @TheStockBandit

Video Review of the Indexes 6-16-2013

June 14, 2013 By Jeff White Filed Under: Index Charts

Stocks worked their way lower within their respective trading ranges last week, unable to build a larger cushion between current prices and near-term support.

As we head into a new week of trading, it’s time once again to take a look at the indexes and the key levels they’re dealing with. This will impact how individual names move, so it’s where every new trading week begins.

Hit the gear icon on the player to select HD and then go full-screen for best quality.

Run time is 6:59.

Trade Like a Bandit!

Jeff White
Take a trial to our Stock Pick Service to get our trades.

Follow @TheStockBandit

Review of the Indexes 6-9-2013

June 9, 2013 By Jeff White Filed Under: Index Charts

A big rally on Friday left the indexes each positive on the week after having continued their pullback off the recent highs.  Thursday’s reversal off the low found more buyers ahead of the weekend with a jobs report that didn’t disappoint and another potential higher low on the daily charts.

As we head into a new week of trading, it’s time once again to take a look at the indexes and the key levels they’re dealing with. This will impact how individual names move, so it’s where every new trading week begins.

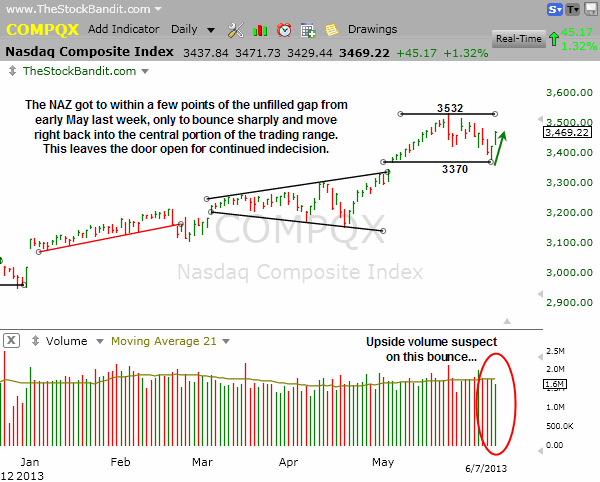
NAZ – The NAZ saw a sharp bounce off the Thursday morning low which nearly tested the unfilled gap from early May.  The rebound was marked by strong finishes both Thursday and Friday, leaving this index just above the middle of the range.  Stay on your toes out there as follow through right now is fleeting.

NAZ-06092013

Why I Use TC2000


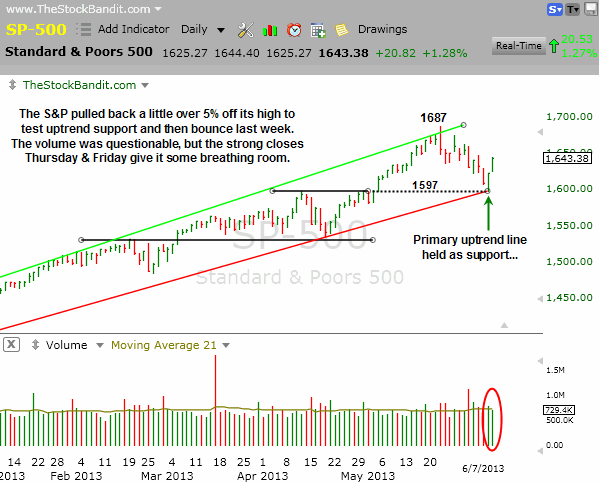
SP500 – The S&P pulled back into Thursday morning to within 1 point of the 1597 level I’ve highlighted previously.  That was resistance in April which gave way to the May breakout, and also coincides with the uptrend line off the November low.  That convergence plus a pullback of roughly 5.3% provided enough incentive for the bulls to step in and put cash to work once again.  How far this bounce carries will tell us quite a lot in the days ahead.

SP500-06092013

Why I Use TC2000


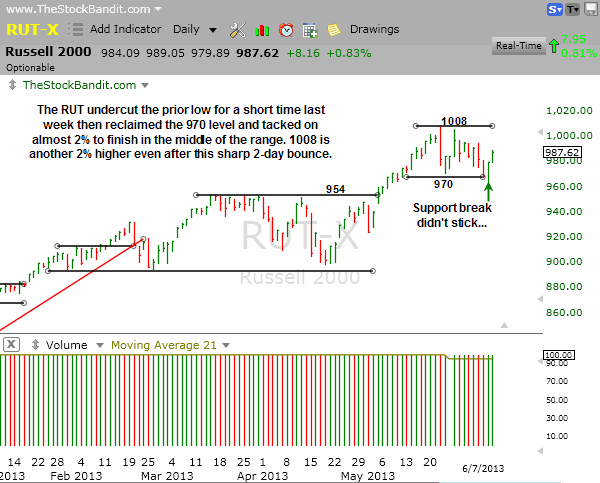
RUT – The RUT undercut the trading range low of 970 last week on Wednesday, but immediately reclaimed it on Thursday and moved higher on Friday to push back toward the center portion of the trading range.  970 is the downside zone to watch, whereas 1008 is upper resistance.

RUT-06092013

Why I Use TC2000


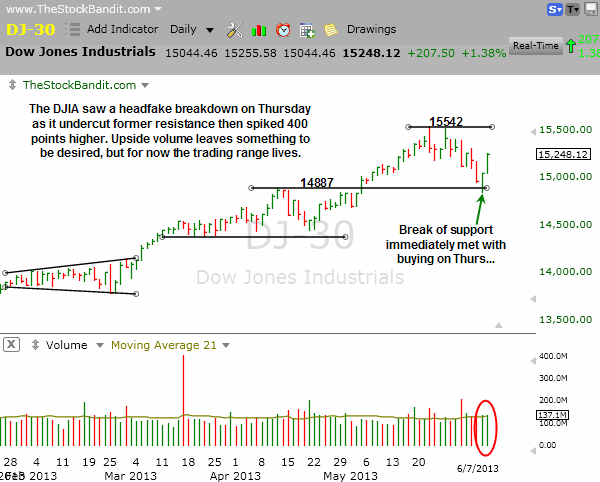
DJIA – The DJIA briefly undercut former resistance at 14887 on Thursday, spending only about an hour beneath it before reclaiming it with a sharp bounce.  The lift into Friday’s close from Thursday’s low was over 400 points, putting into perspective just how sharp the lift was.  Nonetheless, this index remains another 300 points shy of a new high and if this bounce stalls it could create a lower high.  For now, the uptrend remains intact.

DJIA-06092013

Why I Use TC2000


Take a trial to our Stock Pick Service to get our trades.

Trade Like a Bandit!

Jeff White

Follow @TheStockBandit

Review of the Indexes 6-2-2013

June 2, 2013 By Jeff White Filed Under: Index Charts

Last week ended with some hard selling, particularly in the final half hour on Friday.  That resulted in trading range breaks to the downside for both the S&P 500 and DJIA, while the RUT and NAZ were able to hold inside their respective ranges. Was it merely pre-weekend worry or a sign of more selling to come?

As we head into a new week of trading, it’s time once again to take a look at the indexes and the key levels they’re dealing with. This will impact how individual names move, so it’s where every new trading week begins.

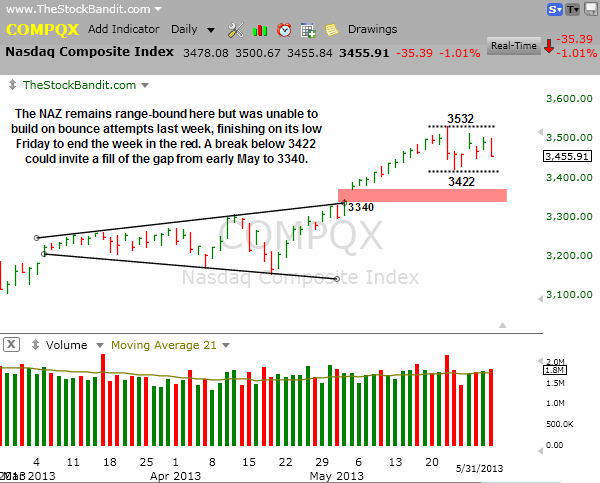
NAZ – The NAZ has 33 points of room on the downside before it would break this trading range to the downside, although on a closing basis Friday constituted the lowest close since May 14.  A hard break below this range invites a gap fill from early May.

NAZ-06022013

Why I Use TC2000


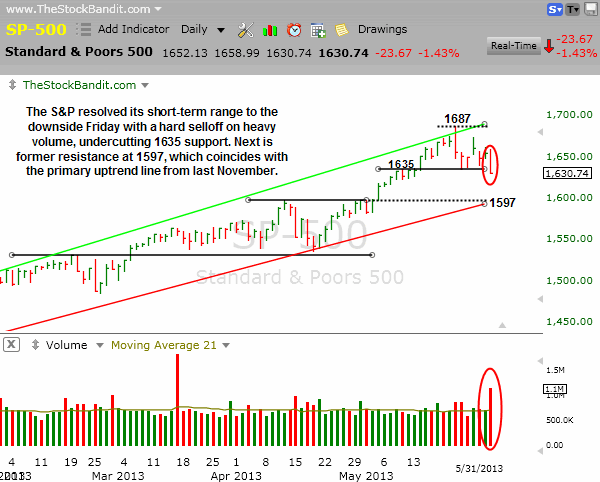
SP500 – The S&P undercut 1635 support on Friday, and now the next level to watch is former resistance at 1597.

SP500-06022013

Why I Use TC2000


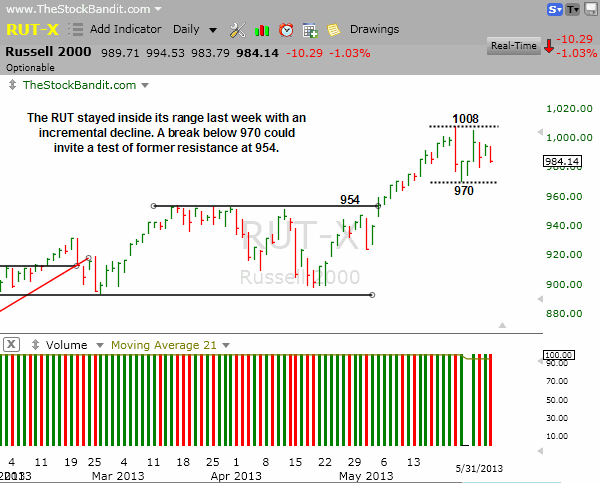
RUT – The lowest RUT close since May 14 is 982, and on Friday it finished just 2 points above that level.  Intraday support was recently found at 970, giving this index a bit of room for now.  Should we see a breakdown there, 954 will be next.

RUT-06022013

Why I Use TC2000


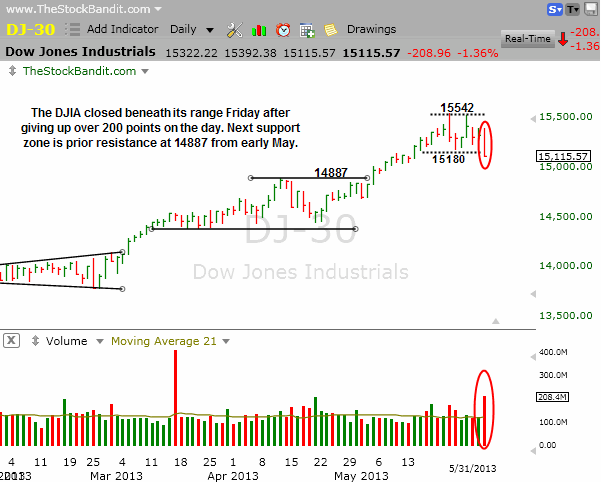
DJIA – The DJIA suffered its worst decline on Friday since April 15th and also broke below its trading range.  There’s about 230 more points of room on the downside before next support would be found.

DJIA-06022013

Why I Use TC2000


Take a trial to our Stock Pick Service to get our trades.
Trade Like a Bandit!

Jeff White

Follow @TheStockBandit

Review of the Indexes 5-27-2013

May 24, 2013 By Jeff White Filed Under: Index Charts

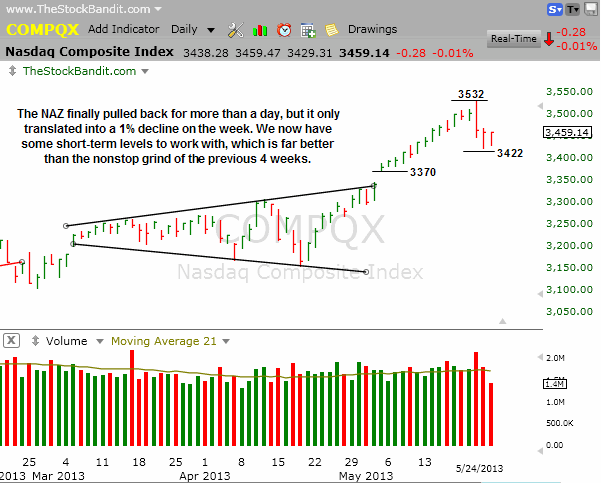
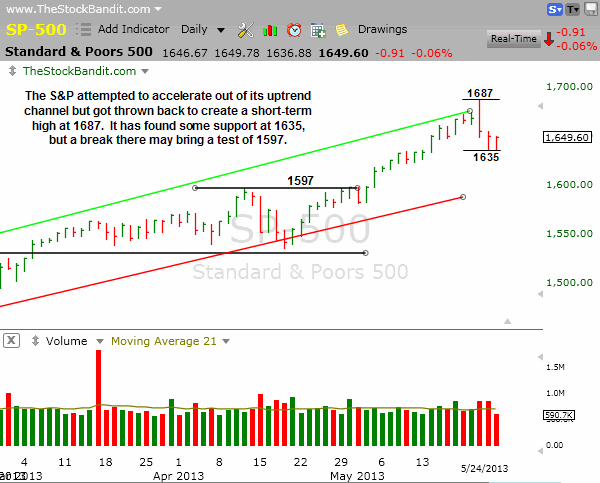
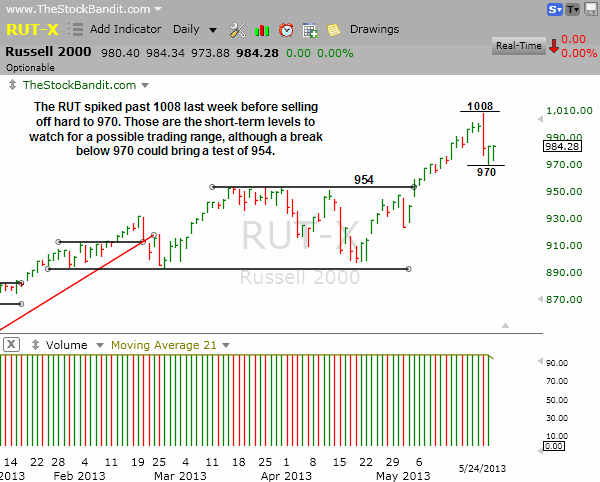
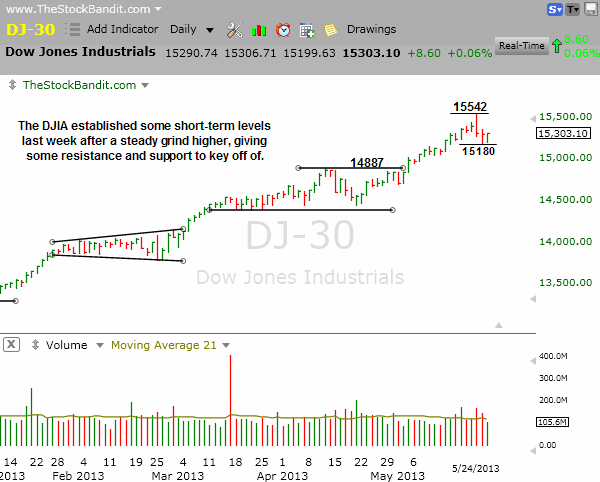
The bulls surrendered their 4-week streak of gains via some profit-taking last week, shaking things up a bit on the charts.

As we head into a new week of trading, it’s time once again to take a look at the indexes and the key levels they’re dealing with. This will impact how individual names move, so it’s where every new trading week begins.

NAZ – The NAZ lost 1.1% for the week, but more importantly carved out some resistance which should prove very helpful to us going forward.

NAZ-05-27-2013

Why I Use TC2000


SP500 – The S&P gave up 1% last week and failed to accelerate out of its channel.  It now stands a little over 2% from its intraday high set last week.

SP500-05-27-2013

Why I Use TC2000


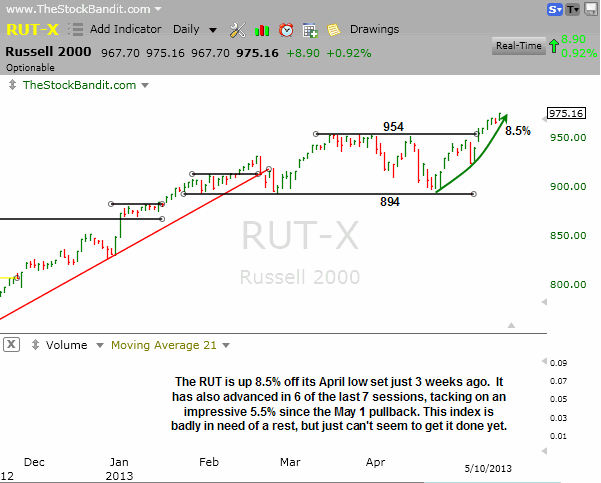
RUT – The RUT reached 4-digit territory last week for the first time ever, then quickly sold off to return to the 900’s.  This small-cap index was overdue a dip, and we now have some short-term levels to utilize for support and resistance.

RUT-05-27-2013

Why I Use TC2000


DJIA – The DJIA may be carving out a bit of a trading range up here, so we’ll keep an eye on the high and low of last week in case price moves laterally from here.

DJIA-05-27-2013

Why I Use TC2000


Take a trial to our Stock Pick Service to get our trades.
Trade Like a Bandit!

Jeff White

Follow @TheStockBandit

Review of the Indexes 5-19-2013

May 19, 2013 By Jeff White Filed Under: Index Charts

The buyers continued their domination last week, marking the 4th consecutive weekly gain since the mid-April pullback.

As we head into a new week of trading, it’s time once again to take a look at the indexes and the key levels they’re dealing with. This will impact how individual names move, so it’s where every new trading week begins.

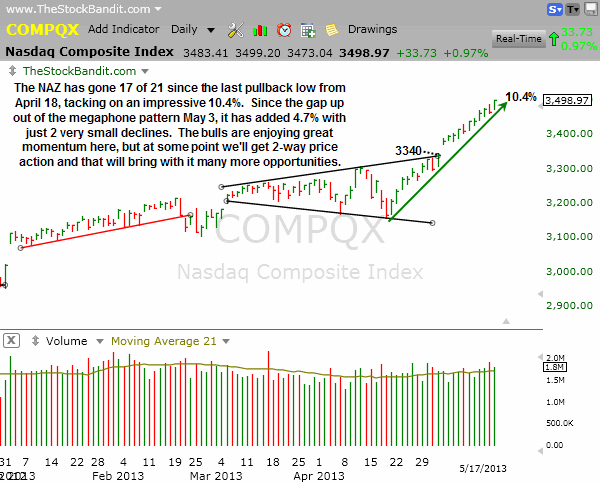
NAZ – The NAZ is up 10.4% since the mid-April low, leaving it very extended with this nonstop move.  Regardless of the near-daily upside progress, getting aggressively long after a run of this magnitude simply involves greater risk as profit-taking will eventually arrive.

NAZ-05-19-2013

Why I Use TC2000


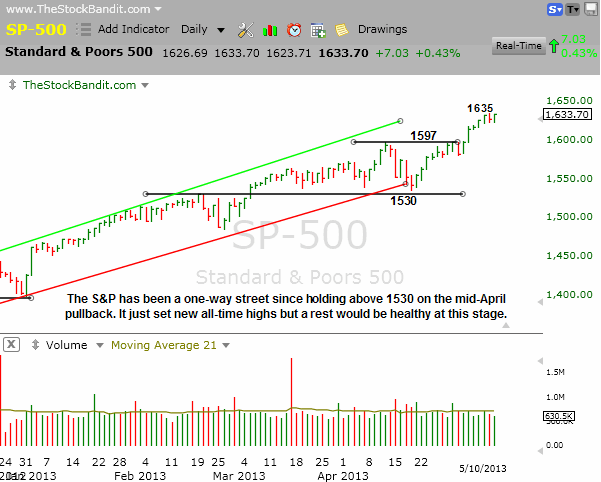
SP500 – The S&P had a measured move projection to about 1665 out of the 67-point trading range (1530-1597) it left behind when it cleared 1597, and on Friday it achieved it plus a couple of points with a close at 1667.  The momentum might last a little longer, but this isn’t a spot to be adding long-sided exposure until at a minimum some rest has taken place.

SP500-05-19-2013

Why I Use TC2000


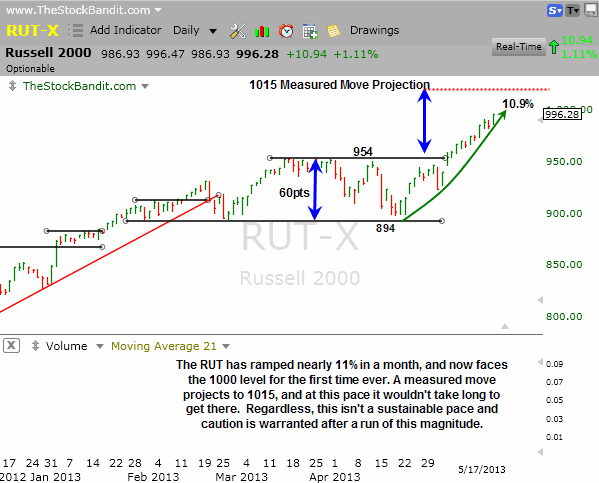
RUT – The RUT is pressing 1000 for the first time ever and is now within 19 points of its measured move to 1015.  This incredible 4-week run has lifted this index nearly 11%, leaving it very extended and well overdue for a breather.

RUT-05-19-2013

Why I Use TC2000


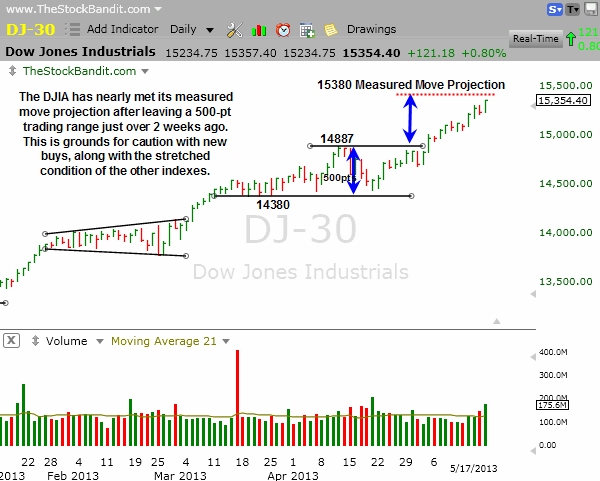
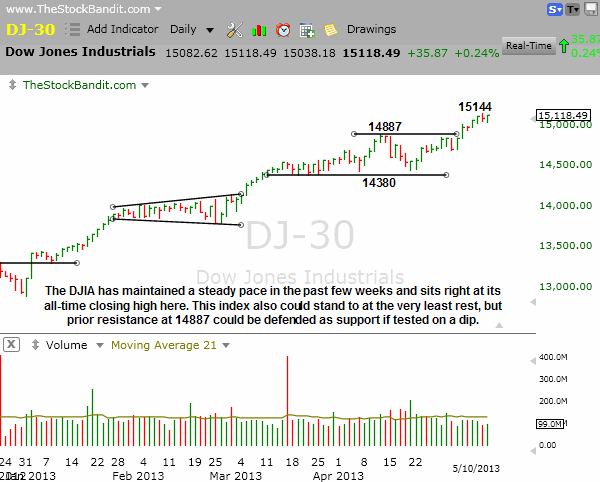
DJIA – The DJIA has nearly met its upside projection as well, closing just 26 points from it as of Friday.  This index is moving at a more sustainable pace (or angle) than the others, but it’ll take cues from them.  As they appear very stretched, caution is warranted in this index as well – particularly after this 500-point breakout in just over 2 weeks time.

DJIA-05-19-2013

Why I Use TC2000


Take a trial to our Stock Pick Service to get our trades.
Trade Like a Bandit!

Jeff White

Follow @TheStockBandit

Review of the Indexes 5-12-2013

May 11, 2013 By Jeff White Filed Under: Index Charts

Stocks continued to ramp last week since turning up from the mid-April low, packing a serious punch to the bears after a Wednesday pullback with back-to-back triple-digit gains on Thursday and Friday.

As we head into a new week of trading, it’s time once again to take a look at the indexes and the key levels they’re dealing with. This will impact how individual names move, so it’s where every new trading week begins.

NAZ – The NAZ just added 9% in about 3 weeks, which simply isn’t a sustainable pace.  Nonetheless, the bulls remain in charge here and there’s no reason to become bearish even if a short-term pause is becoming overdue.

NAZ-05-12-2013

Why I Use TC2000


SP500 – The S&P continues to grind higher since its breakout two weeks ago through 1597 resistance.  It has some breathing room here to potentially pull back on profit-taking and perhaps still hold the 1597 level.  Either way, a higher low looks likely on the next pullback after this 100-point advance.  Based on the height of the rectangle pattern it just broke out from, this index could see a measured move up to the 1665 area.  At this pace, it wouldn’t take long either.

SP500-05-12-2013

Why I Use TC2000


RUT – The RUT closed at a new all-time high on Friday and now stands 21 points above the breakout zone.  That allows for some room should profit-taking kick in, although the last pullback low is now nearly 80 points away.  A measured move from the rectangle pattern takes this index up to 1015, although pauses along the way could make that an easier accomplishment.

RUT-05-12-2013

Why I Use TC2000


DJIA – The DJIA keeps easing higher since its breakout and still has room to fulfill a measured move to the 15380 area based on the height of the rectangle pattern it just left behind.

DJIA-05-12-2013

Why I Use TC2000


Take a trial to our Stock Pick Service to get our trades.

Trade Like a Bandit!

Jeff White

Follow @TheStockBandit

Video Review of the Indexes 5-5-2013

May 5, 2013 By Jeff White Filed Under: Index Charts

Stocks continued to ramp last week since turning up from the mid-April low, packing a serious punch to the bears after a Wednesday pullback with back-t0-back triple-digit gains on Thursday and Friday.

As we head into a new week of trading, it’s time once again to take a look at the indexes and the key levels they’re dealing with. This will impact how individual names move, so it’s where every new trading week begins.

Hit the gear icon on the player to select HD and then go full-screen for best quality.

Run time is 5:56.

Trade Like a Bandit!

Jeff White
Take a trial to our Stock Pick Service to get our trades.
Follow @TheStockBandit

  • « Previous Page
  • 1
  • …
  • 3
  • 4
  • 5
  • 6
  • 7
  • 8
  • Next Page »

Member Login

Become a Member Now
Lost Password


Recommended Broker


Links & Archives

Trading Blog Archives
Join the Email List
About Jeff White
Stock Trading Courses
Testimonials
Recent Performance

Post Categories

Stock Charts Posts
Q&A Posts
Index Charts Posts
Trader Improvement
General Blog Posts

Links

Terms of Service
Privacy Policy
Disclaimer
Site Map
Contact us

Follow


Premium Services

Stock Pick Service
Trading Courses
Trader Coaching

Copyright © 2025 TheStockBandit, Inc. · All Rights Reserved