September has historically been a weak month for the market, but that’s not how this one is shaping up. So far, it’s one of the strongest months of 2013 and last week we saw aggressive buying both ahead of and after the FOMC announcement. Tapering will surface again, but for now, traders are riding the momentum.
As we head into a new week of trading, it’s time once again to take a look at the indexes and the key levels they’re dealing with. This will impact how individual names move, so it’s where every new trading week begins.
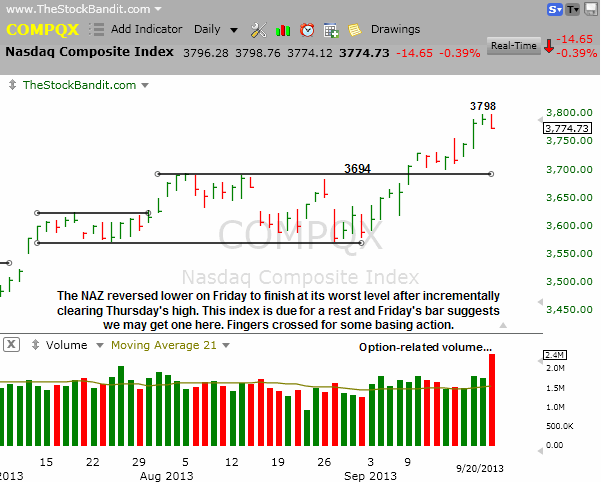
NAZ – The NAZ again reached levels not seen since 2000 last week before backing off Friday with quad-witching volume. This index has kept pullbacks limited in recent weeks but could stand to rest after this 225-point run over just 3 weeks. There’s plenty of room down to 3694 before a breakout failure. Interesting that the measured move projection to 3814 I discussed a week ago was nearly completed last week.
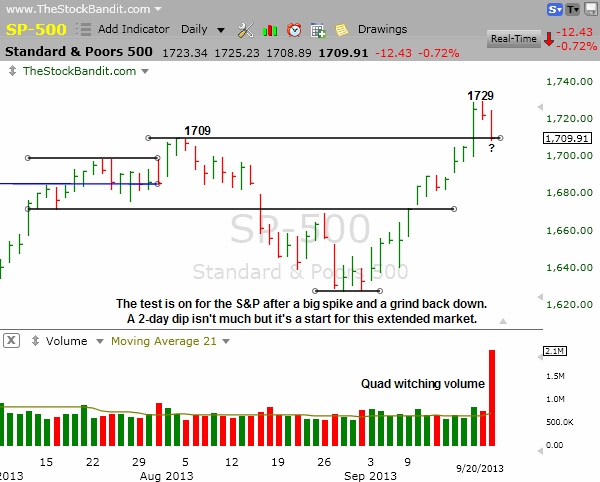
SP500 – The S&P screamed through 1709 on the FOMC news last Wednesday afternoon but spent the rest of the week grinding right back to finish Friday right at 1709. This is the big test of the breakout and bulls won’t want to give up this level. That said, prices are still pretty extended here and some additional basing would be welcomed and healthy at this stage.
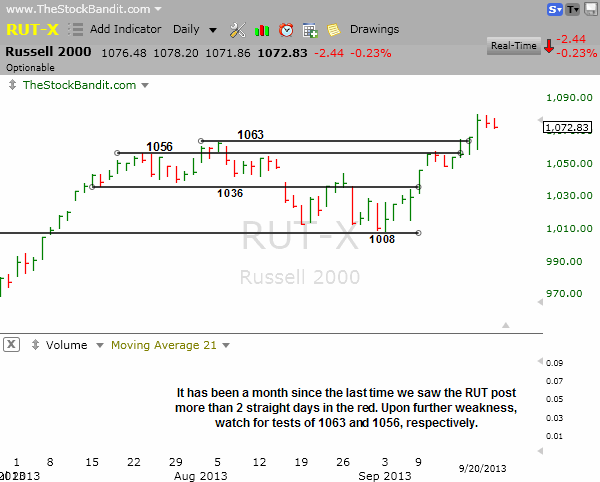
RUT – The RUT painted 2 red bars Thursday and Friday but sure didn’t give up much ground from the 1080 high from Wednesday. Any pullback could easily result in a test of prior resistance levels with the first being 1063 and the next 1056 on the way down. This index is coming off a 7.7% rally in just 3 weeks, so a little give-back would not be surprising.
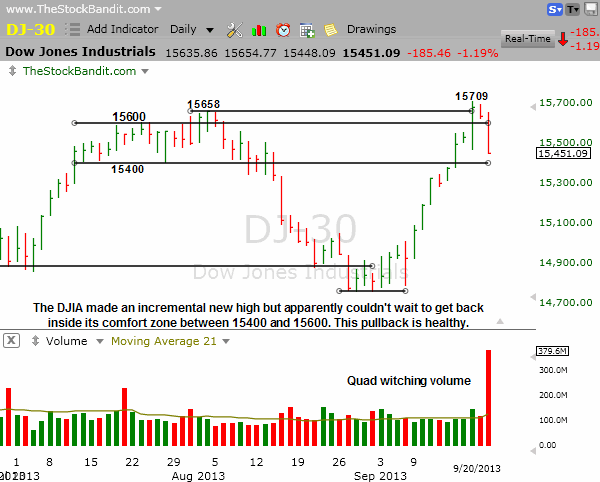
DJIA – The DJIA failed its breakout to a new high last week as it pushed just 51 points past the August high before reversing over 250 points into Friday’s closing bell. It’s now back inside the 200-point trading range we’ve seen it spend considerable time in this summer.
Take a trial of the Stock Pick Service to get my trades.
Trade Like a Bandit!
Jeff White


