TheStockBandit.com

Swing Trading and momentum investing stock pick newsletter and swing trading service.

  • Home
    • Blog Archives
    • Blog Categories
  • About
    • About The Stock Bandit
    • FAQ
    • Contact Us
  • Strategy
    • Join the Email List!
    • Stock Trading Methodology
    • Trading Rules
    • Chart Patterns
  • Products
    • Products Overview
    • Trading Courses
    • Stock Pick Service
    • Recent Trades
    • Trader Coaching
    • Seminar DVD’s
  • Subscription Info

Review of the Indexes 9-29-2013

September 29, 2013 By Jeff White Filed Under: Index Charts

Last week we saw some rest and retreat, depending upon the index.  Small caps held strong with techs, while the blue chips and financials slid with some consistency off their recent highs.  That divergence will be resolved at some point soon, but which side is proving to be the leader here?

As we head into a new week of trading, it’s time once again to take a look at the indexes and the key levels they’re dealing with. This will impact how individual names move, so it’s where every new trading week begins.

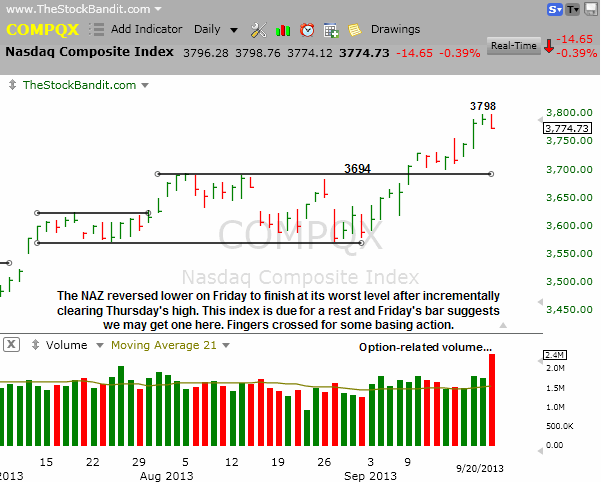
NAZ – The NAZ added about 7 points on the week last week as it continued to respect 3798.  This base-above-base look is certainly bullish, and there’s some additional room for the projection to 3814 out of the July/August trading range, but the bulls are still waiting for the right motivation to make it happen.  At the very least this pause has been healthy to work off the overbought conditions we saw a week ago.

NAZ-9292013

Why I Use TC2000


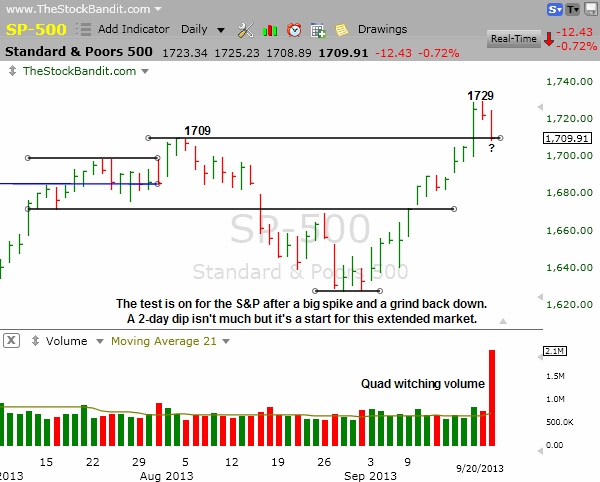
SP500 – The S&P is channeling lower here in the short term as it retraces some of the 102-point rally off the August low.  The failed breakout through 1709 doesn’t help the bull case here, and neither does the persistent weakness of late.  However, a breakout on the NAZ could certainly see a sympathy rally in this index.  Next support is 1671 if we continue to slide.

SP500-9292013

Why I Use TC2000


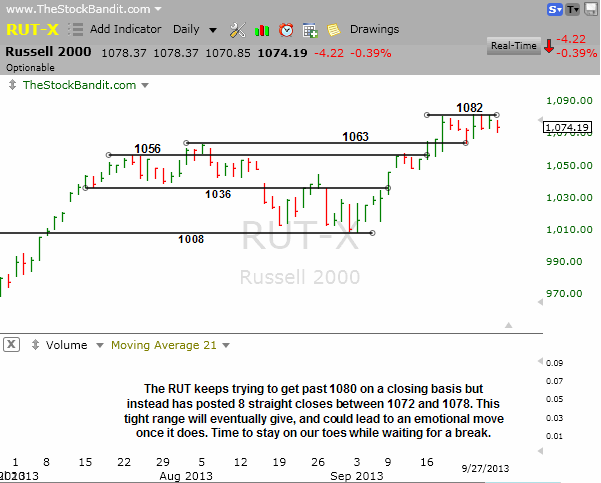
RUT – The RUT keeps finishing in a tight range and is sitting just shy of its all-time high set intraday last week at 1082.  This rest is healthy after the nonstop lift from the August low, but if continuation is going to happen sooner than later this index will need to hold the 1063 breakout, otherwise it’s likely in for a pullback.  Even in the latter scenario this index has ample room to pull back and still create another higher low, so the bulls remain in good shape.

RUT-9292013

Why I Use TC2000


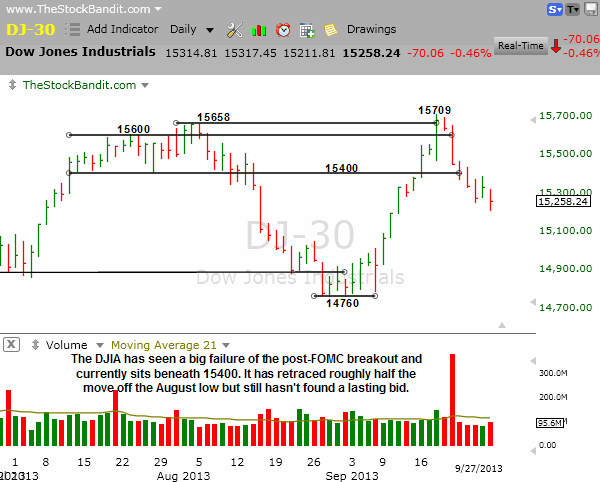
DJIA – The DJIA tried to break out two weeks ago and abruptly failed.  Since then it’s been persistently weak with even last Thursday’s bounce finishing well off the session high.  Friday’s session marked a new pullback low.  Some stabilization here could carve out a higher low, but the bulls likely have a little emotional baggage in the short term after the breakout failure.

DJIA-9292013

Why I Use TC2000


Take a trial of the Stock Pick Service to get my trades.

Trade Like a Bandit!

Jeff White

Follow @TheStockBandit

Review of the Indexes 9-22-2013

September 22, 2013 By Jeff White Filed Under: Index Charts

September has historically been a weak month for the market, but that’s not how this one is shaping up.  So far, it’s one of the strongest months of 2013 and last week we saw aggressive buying both ahead of and after the FOMC announcement.  Tapering will surface again, but for now, traders are riding the momentum.

As we head into a new week of trading, it’s time once again to take a look at the indexes and the key levels they’re dealing with. This will impact how individual names move, so it’s where every new trading week begins.

NAZ – The NAZ again reached levels not seen since 2000 last week before backing off Friday with quad-witching volume. This index has kept pullbacks limited in recent weeks but could stand to rest after this 225-point run over just 3 weeks.  There’s plenty of room down to 3694 before a breakout failure. Interesting that the measured move projection to 3814 I discussed a week ago was nearly completed last week.

NAZ-9222013

Why I Use TC2000


SP500 – The S&P screamed through 1709 on the FOMC news last Wednesday afternoon but spent the rest of the week grinding right back to finish Friday right at 1709.  This is the big test of the breakout and bulls won’t want to give up this level.  That said, prices are still pretty extended here and some additional basing would be welcomed and healthy at this stage.

SP500-9222013

Why I Use TC2000


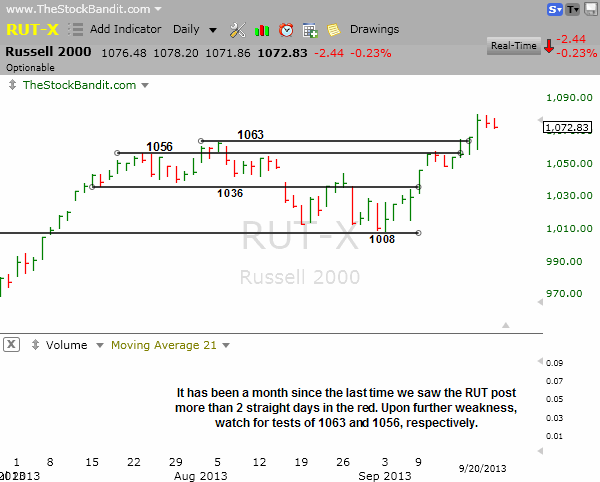
RUT – The RUT painted 2 red bars Thursday and Friday but sure didn’t give up much ground from the 1080 high from Wednesday. Any pullback could easily result in a test of prior resistance levels with the first being 1063 and the next 1056 on the way down.  This index is coming off a 7.7% rally in just 3 weeks, so a little give-back would not be surprising.

RUT-9222013

Why I Use TC2000


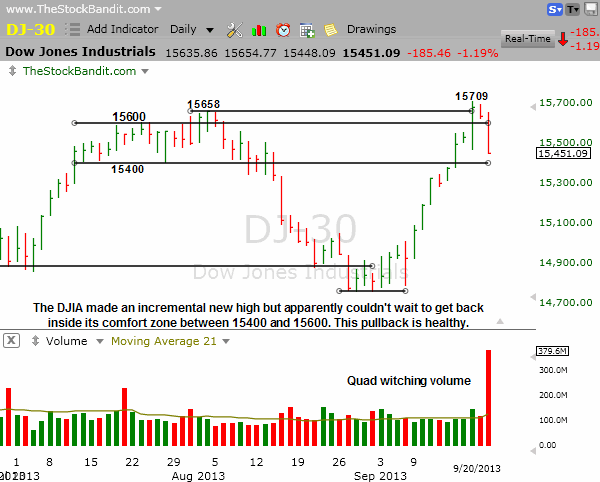
DJIA – The DJIA failed its breakout to a new high last week as it pushed just 51 points past the August high before reversing over 250 points into Friday’s closing bell.  It’s now back inside the 200-point trading range we’ve seen it spend considerable time in this summer.

DJIA-9222013

Why I Use TC2000


Take a trial of the Stock Pick Service to get my trades.

Trade Like a Bandit!

Jeff White

Follow @TheStockBandit

Review of the Indexes 9-15-2013

September 14, 2013 By Jeff White Filed Under: Index Charts

The bulls maintained their edge last week with some continued strength and then some much-needed basing action.

As we head into a new week of trading, it’s time once again to take a look at the indexes and the key levels they’re dealing with. This will impact how individual names move, so it’s where every new trading week begins.

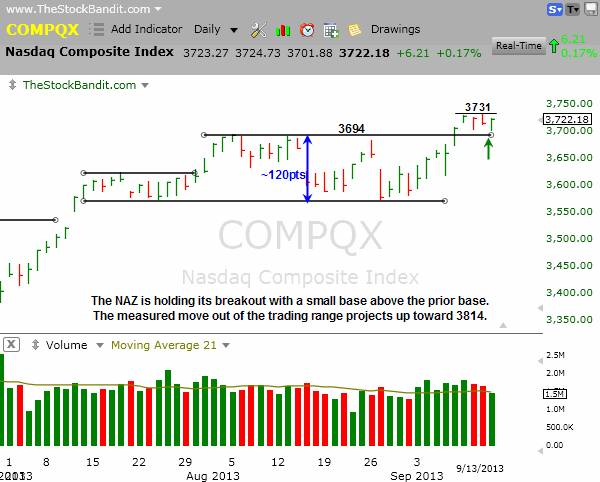
NAZ – The NAZ made a new high by clearing 3694, saw some follow through, and then rested the final three sessions of the week.  This bodes well for continuation higher, and there’s potential for a measured move to 3814 by adding the channel height to the breakout level.

NAZ-9-15-2013

Why I Use TC2000


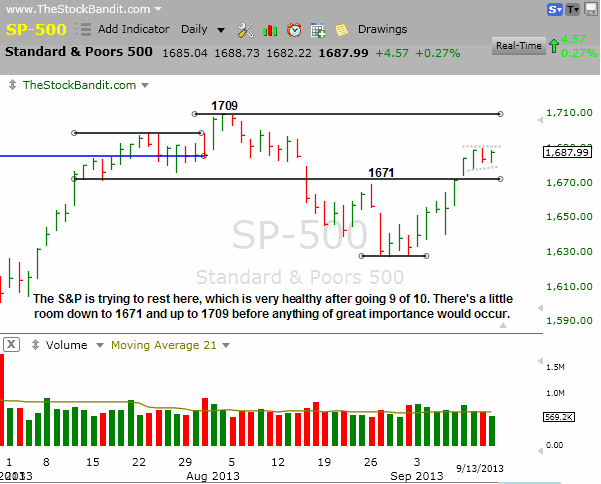
SP500 – The S&P is trying to base here with a miniature bull pennant after a big ramp off the recent pullback low.  It has reclaimed 1671 and filled a gap last week to 1685 and now sits just over 1% from the all-time high of 1709.

SP500-9-15-2013

Why I Use TC2000


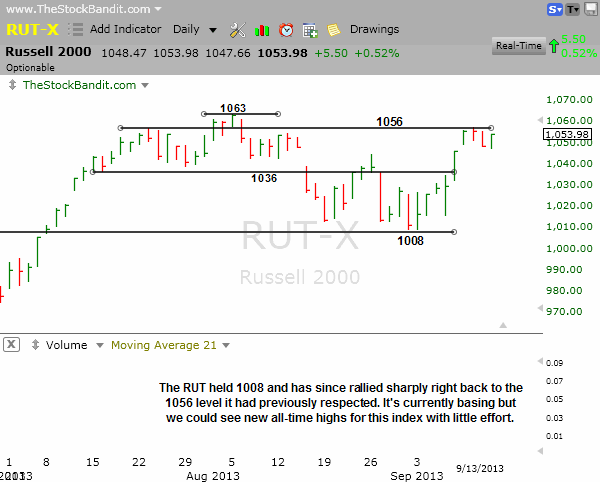
RUT – The RUT saw a huge rally off the key 1008 area to return to 1056, another level it has respected multiple times including this summer.  That said, it’s not far from a breakout and new all-time highs could be painted soon on this daily chart.  Any and all rest is welcomed at this stage but the past 3 sessions have certainly helped to digest the recent lift.

RUT-9-15-2013

Why I Use TC2000


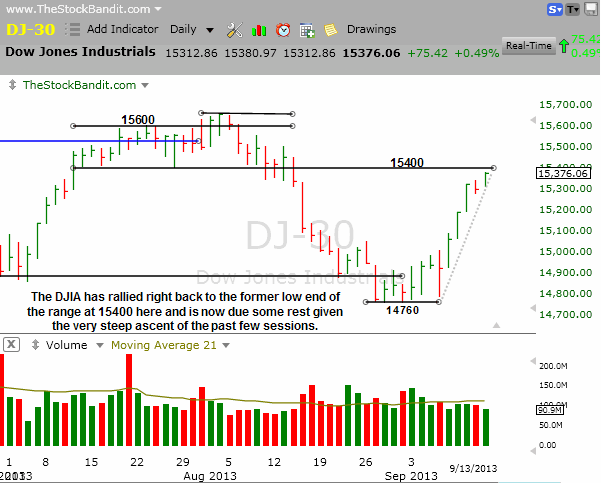
DJIA – The DJIA saw a huge advance last week to get within spitting distance of the 15400 level it broke down from in August. This index now needs some rest after this steep rally.

DJIA-9-15-2013

Why I Use TC2000


Take a trial of the Stock Pick Service to get my trades.

Trade Like a Bandit!

Jeff White

Follow @TheStockBandit

Video Review of the Indexes 9-8-2013

September 8, 2013 By Jeff White Filed Under: Index Charts

The major averages lifted from short-term support levels last week, but facing plenty of uncertainty, failed to exhibit a real commitment on the upside.

As we head into a new week of trading, it’s time once again to take a look at the indexes and the key levels they’re dealing with. This will impact how individual names move, so it’s where every new trading week begins.

Hit the gear icon on the player to select HD and then go full-screen for best quality.

Run time is 6:32.

Trade Like a Bandit!

Jeff White
Take a trial to my Stock Pick Service to get my trades.

Follow @TheStockBandit

Video Review of the Indexes 9-2-2013

September 1, 2013 By Jeff White Filed Under: Index Charts

The major averages respected some key levels last week but maintained their recent habit of strength getting sold.

As we head into a new week of trading, it’s time once again to take a look at the indexes and the key levels they’re dealing with. This will impact how individual names move, so it’s where every new trading week begins.

Hit the gear icon on the player to select HD and then go full-screen for best quality.

Run time is 7:37.

Trade Like a Bandit!

Jeff White
Take a trial to my Stock Pick Service to get my trades.

Follow @TheStockBandit

Review of the Indexes 8-25-2013

August 25, 2013 By Jeff White Filed Under: Index Charts

We’ve gotten a steady pullback since early in the month, and that has proven to be welcomed by bulls and bears alike.  Is this a dip we can aggressively buy just like the others since November, or is there still some selling to come?  We’ll let the charts speak for themselves on that.

As we head into a new week of trading, it’s time once again to take a look at the indexes and the key levels they’re dealing with. This will impact how individual names move, so it’s where every new trading week begins.

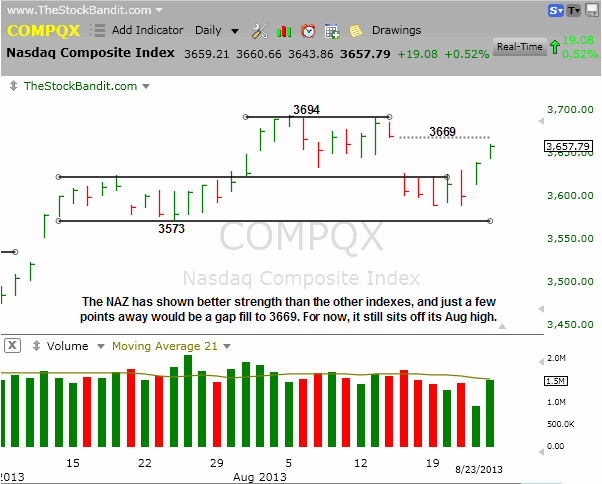
NAZ – The NAZ has lifted quickly from its pullback low and now is working on filling a gap from two weeks ago. Beyond that, resistance still looms.

NAZ-08252013

Why I Use TC2000


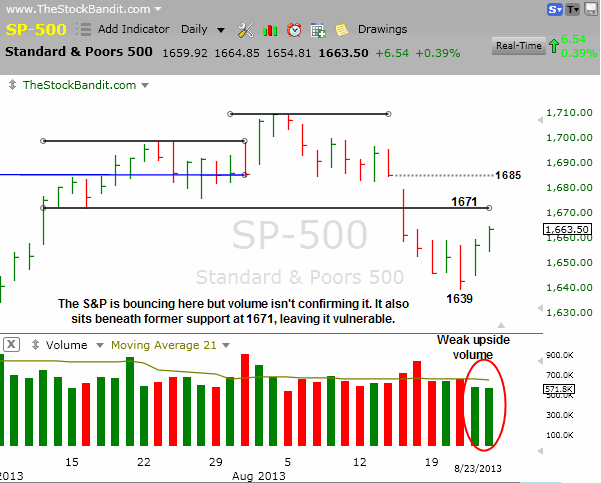
SP500 – The S&P has rebounded from 1639 but volume isn’t confirming this lift.  Toss into the mix the fact that this index has not yet reclaimed former support at 1671, and there are plenty of reasons to remain cautious in the short term.

SP500-08252013

Why I Use TC2000


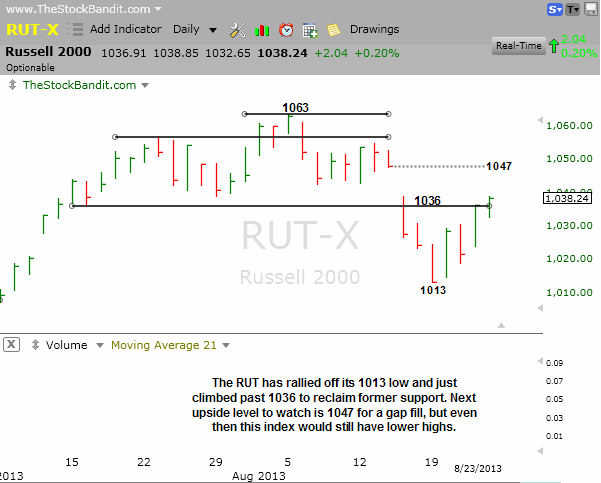
RUT – The RUT got back above 1036 last week but now faces a gap to 1047.  If it’s able to fill that void, there are still a pair of resistance levels beyond that at 1056 and 1063, respectively.

RUT-08252013

Why I Use TC2000


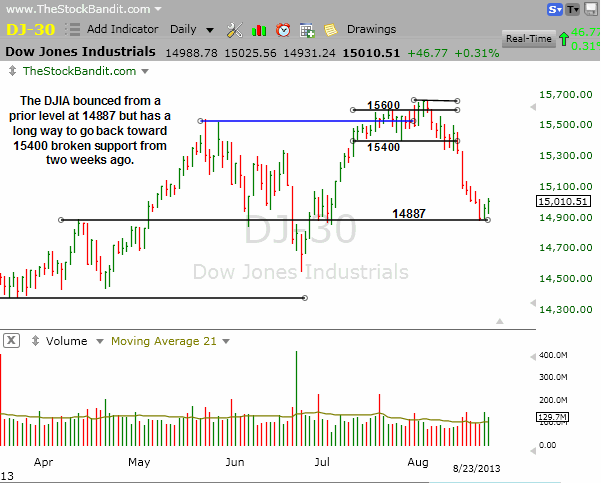
DJIA – The DJIA held the 14887 level last week and is getting a modest bounce from that level, as expected.  However, it’s a long climb back to 15400 broken support, so it’s difficult to expect lasting upside just yet.

DJIA-08252013

Why I Use TC2000


Take a trial of the Stock Pick Service to get my trades.

Trade Like a Bandit!

Jeff White

Follow @TheStockBandit

Video Review of the Indexes 8-18-2013

August 16, 2013 By Jeff White Filed Under: Index Charts

The major averages saw a change of character last week, taking us out of the 5-week trading ranges which have kept price movement so restricted for much of the summer.  Now, all eyes are on the bulls to see whether this wake-up call will prompt them to defend the trend, or if instead it’s the bears’ time to shine.

As we head into a new week of trading, it’s time once again to take a look at the indexes and the key levels they’re dealing with. This will impact how individual names move, so it’s where every new trading week begins.

Hit the gear icon on the player to select HD and then go full-screen for best quality.

Run time is 6:45.

Trade Like a Bandit!

Jeff White
Take a trial to my Stock Pick Service to get my trades.

Follow @TheStockBandit

Review of the Indexes 8-4-2013

August 4, 2013 By Jeff White Filed Under: Index Charts

The major averages broke out last week, but with varying degrees of intensity.  We’ll need to see better unity if this fresh advance is to have legs, so the week ahead will be a very important one for the bulls.

As we head into a new week of trading, it’s time once again to take a look at the indexes and the key levels they’re dealing with. This will impact how individual names move, so it’s where every new trading week begins.

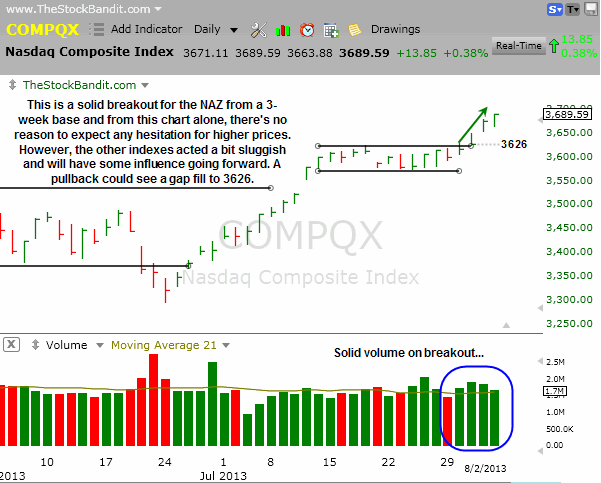
NAZ – The NAZ exhibited the most strength last week with a hesitation breakout Wednesday followed by a big day Thursday and some follow through on Friday.  It has plenty of room to breathe now, with the gap to 3626 being the next downside level to watch.  Just beneath that is the prior high just 2 points lower at 3624.

NAZ-8-4-2013

Why I Use TC2000


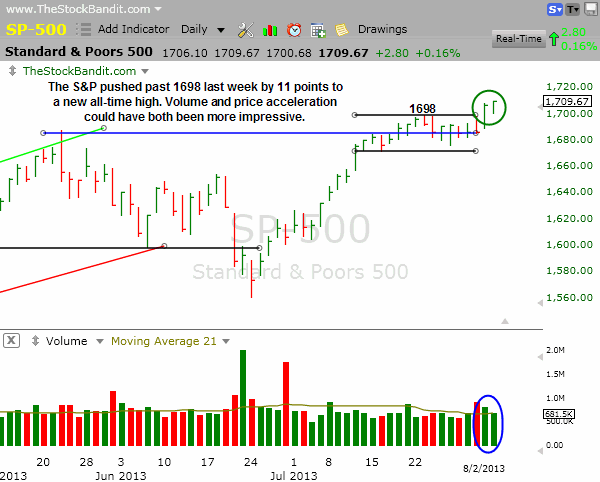
SP500 – The S&P cleared the 1700 level last week, but still isn’t far from it.  Volume wasn’t overly impressive either, which means the bulls still have some work to do if they intend to build on this breakout in a more convincing fashion.  This is a new all-time high and that should not be discounted, but the breakout needs to stick.

SP500-8-4-2013

Why I Use TC2000


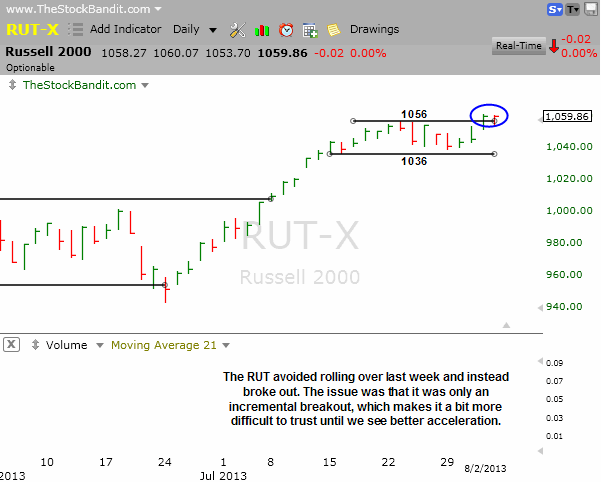
RUT – The RUT avoided the rounded top that still looked to be in play even mid-week last week and pushed north to reach a new all-time high.  Here again though, this is only an incremental breakout and therefore the bulls still have some proving to do if it’s going to stick.

RUT-8-4-2013

Why I Use TC2000


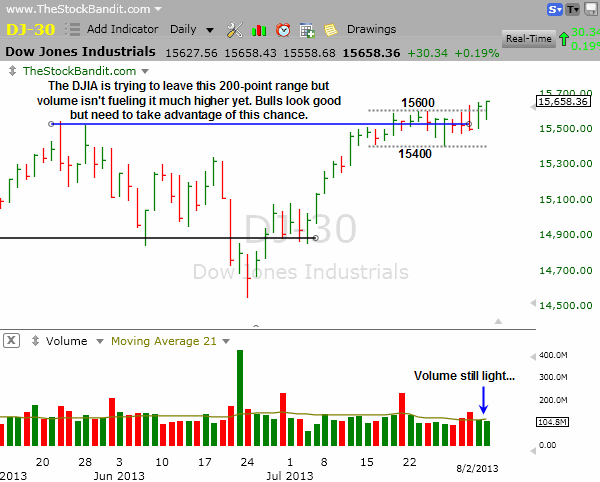
DJIA – The DJIA has spent the bulk of the past 3 weeks in a 200-point range between 15400 and 15600.  On Thursday and Friday, it closed above 15600 but still is only a few points from it.  Volume was light, making this breakout a bit suspect until greater acceleration in price or stronger volume is seen to accompany the start of this new advance.

DJIA-8-4-2013

Why I Use TC2000


Take a trial of the Stock Pick Service to get my trades.

Trade Like a Bandit!

Jeff White

Follow @TheStockBandit

Review of the Indexes 7-28-2013

July 28, 2013 By Jeff White Filed Under: Index Charts

The major averages churned last week, giving nobody satisfaction.  The relentless run higher was put on hold for all but the NAZ, yet no pullback was provided for bulls to allocate additional funds or for bears to cover shorts into.  It was by all measures a standoff.

As we head into a new week of trading, it’s time once again to take a look at the indexes and the key levels they’re dealing with. This will impact how individual names move, so it’s where every new trading week begins.

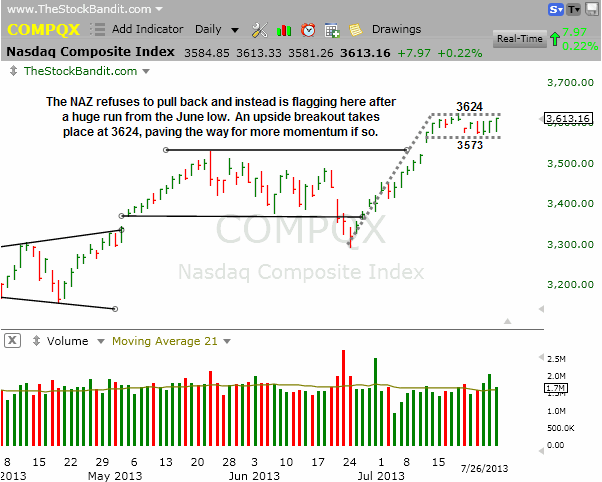
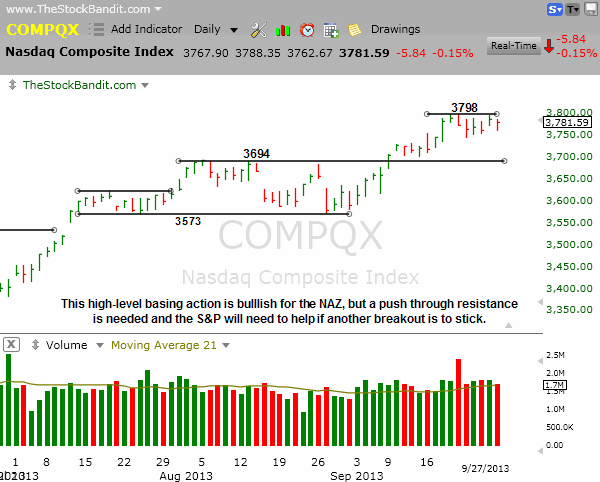
NAZ – The NAZ led the way last week, thanks in part to positive earnings reactions to AAPL, FB, AMZN, SBUX and others.  This index was the only one with a meaningful gain, although it held inside its recent high-level base to continue building the large bull flag pattern.  A breakout to a new high could see this index stretch its legs further, which would happen beyond 3624.  A pullback would be ideal, but it just can’t seem to pull it off.

NAZ-7-28-2013

Why I Use TC2000


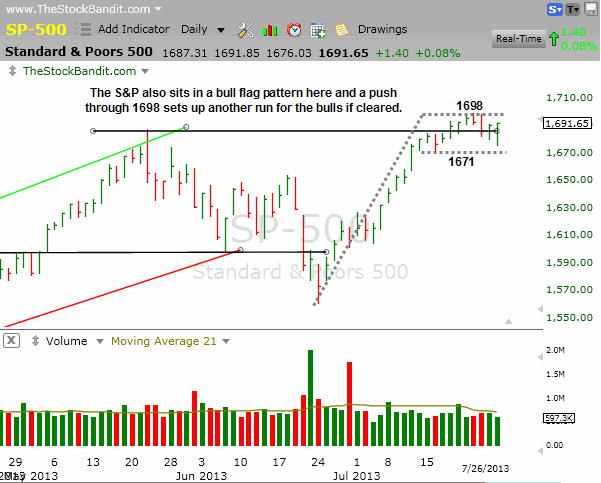
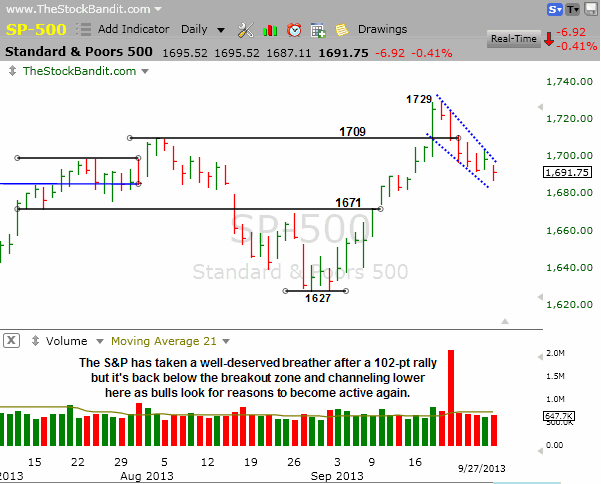
SP500 – The S&P continues to churn just beneath 1700, and this index also has not been able to put together even a modest pullback.  Even quiet declines on Thursday and Friday were each met with afternoon strength, erasing the deficits for each session and leaving this index at its highs by the closing bell.  We’ve seen a little bit of rest, but no pullback.  Any breakout through 1700 will need to stick, as a breakout followed by a reversal would be viewed by many as a short-term last gasp for this big lift off the June lows.

SP500-7-28-2013

Why I Use TC2000


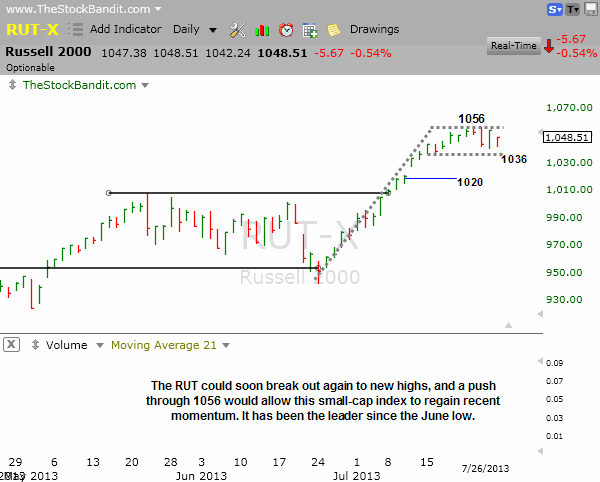
RUT – The RUT remains just a few points shy of its highs as well, but has attempted to pull back a bit in the past few sessions.  This daily chart has a bit more of a rounded look to it than the other flags we’re seeing.  Nonetheless, it too is proving to be very resilient despite having become extremely overbought just a few short days ago.  Keep a close eye on the high at 1056 and the unfilled gap below with room to 1020 just in case it rolls over.

RUT-7-28-2013

Why I Use TC2000


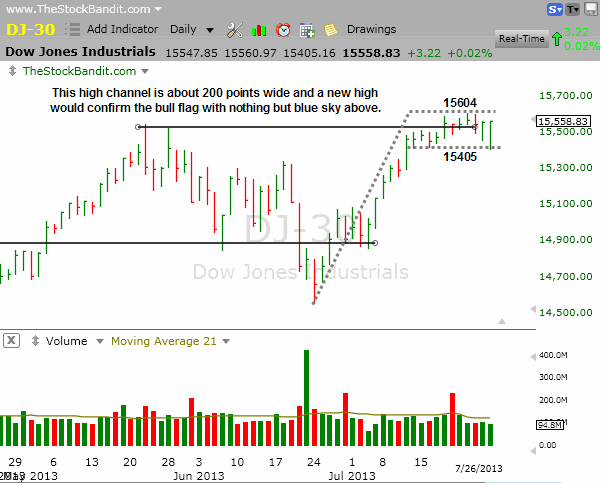
DJIA – The DJIA is the least extended of the bunch, yet it isn’t likely to take off without the others.  For now, it’s in rest mode and that’s certainly a positive way to digest the recent run off the June low.  The high is at 15604 and a solid push through there would confirm this bull flag-like pattern, paving the way for much higher prices.

DJIA-7-28-2013

Why I Use TC2000


Take a trial of the Stock Pick Service to get my trades.

Trade Like a Bandit!

Jeff White
Follow @TheStockBandit

Video Review of the Indexes 7-21-2013

July 19, 2013 By Jeff White Filed Under: Index Charts

The market reached new highs again last week, but the air seems to be getting a bit thin.  We’ve also seen some similar-sized moves to the spring rallies, so if the market has a memory it may finally be time to consolidate.

As we head into a new week of trading, it’s time once again to take a look at the indexes and the key levels they’re dealing with. This will impact how individual names move, so it’s where every new trading week begins.

Hit the gear icon on the player to select HD and then go full-screen for best quality.

Run time is 7:44.

Trade Like a Bandit!

Jeff White
Take a trial to our Stock Pick Service to get our trades.

Follow @TheStockBandit

  • « Previous Page
  • 1
  • 2
  • 3
  • 4
  • 5
  • 6
  • …
  • 8
  • Next Page »

Member Login

Become a Member Now
Lost Password


Recommended Broker


Links & Archives

Trading Blog Archives
Join the Email List
About Jeff White
Stock Trading Courses
Testimonials
Recent Performance

Post Categories

Stock Charts Posts
Q&A Posts
Index Charts Posts
Trader Improvement
General Blog Posts

Links

Terms of Service
Privacy Policy
Disclaimer
Site Map
Contact us

Follow


Premium Services

Stock Pick Service
Trading Courses
Trader Coaching

Copyright © 2025 TheStockBandit, Inc. · All Rights Reserved