TheStockBandit.com

Swing Trading and momentum investing stock pick newsletter and swing trading service.

  • Home
    • Blog Archives
    • Blog Categories
  • About
    • About The Stock Bandit
    • FAQ
    • Contact Us
  • Strategy
    • Join the Email List!
    • Stock Trading Methodology
    • Trading Rules
    • Chart Patterns
  • Products
    • Products Overview
    • Trading Courses
    • Stock Pick Service
    • Recent Trades
    • Trader Coaching
    • Seminar DVD’s
  • Subscription Info

Which Trading Range Play is Best?

May 8, 2014 By Jeff White Filed Under: Q&A

Every week, I get an email along the lines of:

Jeff, I’m looking at XYZ for a short at channel resistance – what do you think of this play?

I’m happy to discuss potential plays in this way with Bandits, as it’s one of the ways I try to help them. The short answer is that it depends on the channel.

Channeling stocks can offer some good plays, no question about it. That’s especially true if you’re patient enough to wait for an often-choppy move to develop. The very nature of a trading range is that price lacks momentum, so lasting moves are inherently hard to come by.

In tilted channels (rising channels or descending channels), I want to trade in the direction of the overall movement. So in an ascending channel pattern, I want to look for spots to get long against support and look to lighten up as price approaches the upper end of the channel. In a descending channel pattern, I want to look for spots to get short against upper resistance and aim to cover as price nears the lower end of the channel. Why not trade with the wind at my back?

But in lateral channels, it’s certainly a fair question to ask which side makes the most sense – long or short?

Personally, I’ve found that in lateral ranges it still pays to defer to the existing trend. Even if price has been somewhat stagnant in recent days or weeks, a steady uptrend over the past several months still shows that the buyers are in control (and vice-versa in a downtrend). The news flow also tends to perpetuate existing trends, so I keep that in mind as well.

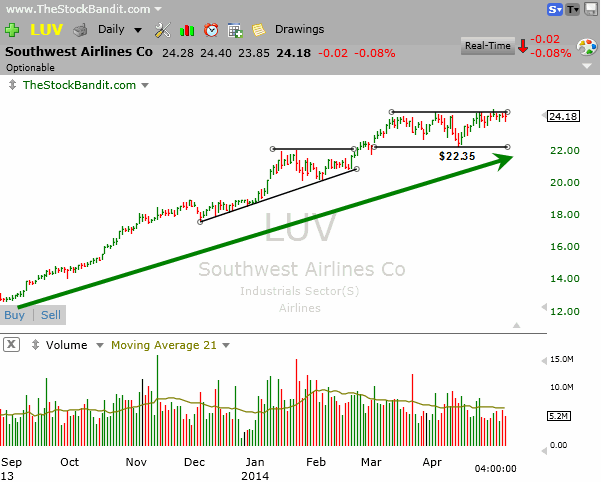
Take LUV, for example, as it is right now. Here’s the chart, along with some comments on it below:
LUV-05072014

Why I Use TC2000

Price has trended higher now for 8 months and counting. Over the past several weeks, it has carved out a well-defined trading range and currently sits at the top end of that range.

Yes, there’s certainly a chance that price retreats back down toward the $22.35 support area, but it’s also just a short distance from breakout territory. That’s a favorable reward:risk ratio of about 3:1, but the end result is that I’d still be shorting a stock within an uptrend.  That just isn’t my preferred play. I’d rather see an existing downtrend or lateral trend before considering a short against this kind of upper resistance.

One other item about trading within channels is that I never count on a move all the way to the edge of the range. Instead, I want to see a move which nears the boundary and therefore look to make an exit prior to then. Often that’s 1% or so from the actual trend line. Because reversals are common within channels and ranges, if I’ve caught the bulk of the move then it’s time to book it and move on.

Trade Like a Bandit!

Jeff White
Take a trial to the Stock Pick Service to get my trades.
Follow @TheStockBandit on Twitter

Share on StockTwits

Fundamentals vs. Technicals in Trading

April 29, 2014 By Jeff White Filed Under: Q&A

It’s an age-old question among traders & investors, and one I was recently asked by Joel…

What (if any) fundamentals do you consider in your analysis? Do you even look to see if the company is making money, or do none of the financial basics enter your analysis?

My analysis is based on the charts.  Whether or not the company is making money, that does not enter into my strategy.  Stocks rise and fall based on demand for shares and not necessarily profitability of the company itself.  In addition, the fundamentals of a company don’t frequently change, and my timeframe for many trades is days and weeks, not months.  During my timeframe, the fundamentals will rarely change to a great extent.

There are companies which have much to prove whose stocks are rising, and there are solid companies that make lots of money whose stocks are falling.  Sometimes there’s overlap there, but there’s often a disconnect between the two and many investors struggle to recognize that.

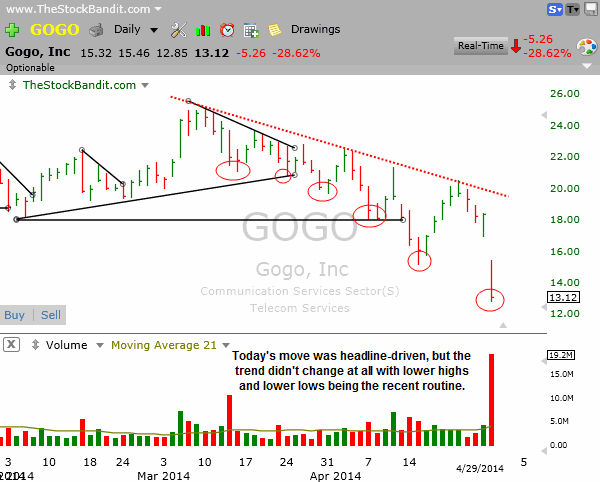
Consider also the way news flow often corresponds with the price action.  Take, for example, the move in GOGO today.  Rival AT&T announced plans to offer in-flight wireless, and GOGO tanked.

Was that meaningful news?  Absolutely.  Will competition hurt revenues, earnings, and the bottom line for GOGO?  You bet!

But look at the chart below.  Lower highs and lower lows have been the norm since the early-March recovery high, so it’s been trending lower for a number of weeks.  The news flow corresponded with the existing trend in the stock and simply accelerated the correction like gas on a fire.

GOGO-04292014

Why I Use TC2000


In my own trading, price action is king and trumps all else.  Maybe the fundamentals are great, and maybe they are poor.  But if timing is everything in the market, and I believe it is, then I have to go with the charts which change daily and not the fundamentals which are only periodically updated.

Trade Like a Bandit!

Jeff White
Take a trial to my Stock Pick Service to get my trades.

Follow @TheStockBandit

How Do You Measure Your Risk?

April 22, 2014 By Jeff White Filed Under: Q&A

How do you measure your risk?

tsb_riskIt’s a question I field frequently, and one which every trader should ask themselves.  Sometimes it’s asked in relation to the percentage of portfolio per trade question I discussed last week.

Beyond my comments there, there are a few things I consider anytime I’m putting on a new trading position:

Position Size – I do not try to put the same dollar amount into each trade, because for me that does not matter.  Two trades can be night and day different from each other in terms of their respective price action and personality.

In the post referenced above, I explained that I have a set $ amount that I’m willing to lose if the trade fails, which is my risk.  Position size is then calculated based on that number.

So for ease of example, let’s say I’m willing to lose (risk) $1000 on a trade if I get stopped out for my max loss. Let’s look at 2 trade candidates for a fair comparison…

Trade 1: XYZ with $25 buy point, $24.50 stop (beneath support on chart). There is $0.50/share risk, so I would enter 2000 shares ($50,000 worth of the stock).

Trade 2: ABC with a $25 buy point, $24 stop (beneath support on chart). There is $1/share risk, so I would enter 1000 shares ($25,000 worth of the stock).

So while my actual capital outlay for one trade vs. the next might really differ, I’m keeping my max $ risk constant across trades.

Target setting – The targets for my trades will also vary in terms of absolute $ or %, but they will be pretty consistent when comparing risk/reward. I want to always be putting capital at risk for a defined max loss amount, while still looking to make some multiple of 2-4 times what is being risked if the trade does work out.  That’s the case for swing trades and single-day plays alike.

I do put money behind my ideas. What I’m sharing with Bandits in the nightly report is my trading plan for the following day, so these are the actual trades I’m setting up for the following day to make in my own account, not a recommendation for others to take these plays.  I don’t decide what’s right for anyone else, I simply share my plan, my levels, and my reasons for the trades I’m making.  They’re the best setups I’ve found, so that’s where my capital goes.  But a crucial element in that process is measuring my risk and ensuring the trade fits my needs.

Trade Like a Bandit!

Jeff White
Take a trial to my Stock Pick Service to get my trades.

Follow @TheStockBandit

Percentage of Portfolio Per Trade?

April 15, 2014 By Jeff White Filed Under: Q&A

A trader named Thomas recently asked the following:

Jeff, What percentage of your trading portfolio do you put on one trade?

howidecidepercentageThis was my reply:

Rather than designate x% of my funds (ex: 10% of account) to each trade or a set amount of money per trade (ex: $20,000 per stock), I take a different approach.  I will typically designate an amount that I’m willing to lose in any given trade should it happen to fail.

The difference is that I’m weighing my actual risk, not the capital required to put on a position.

That amount for me is usually in the neighborhood of .5% (1/2 of 1%) of my account.  For a round-number example, on a $100,000 account that would equate to a max loss in any trade of $500 (.5%).  That amount will change periodically based on a few factors, including:

  • My confidence in the setup.  If the play looks exceptional, the risk/reward is better than usual, and the overall market conditions are particularly conducive for the play, I may be a bit more aggressive than if it were simply a clean pattern which looks to have some potential.
  • The way I’ve been trading.  If I’ve been trading well, then I need to scale up my size and take advantage of that so that I’m pressing only when I’m ahead.  I want to be more aggressive when I’m trading well and back off when I’m not.  If I’ve been off my game, then I’ll put less on the line until I start to find my groove again. Therefore, my recent performance always has a direct influence on my size.
  • The personality of the stock.  A wild stock with big fluctuations is going to get less of my money than one that moves slower, which is directly correlated to the width of the stop and therefore the size of the position.  How a stock behaves should always play a role in ‘how much.’
  • How many other positions I’m expecting to have.  If there are quite a few plays surfacing, I want to be getting positioned in several of them.  Often that will mean I’m splitting funds a little more thinly across the larger number of plays.  But if there isn’t much happening and I can devote more of my attention to just a couple of positions, then I just stick with full-sized positions based on the % of risk I’m currently accepting.

So at times I’ll have more on the line than at others, but usually it’s between .5% and 1% of my account at risk of loss in any given trade.

Trade Like a Bandit!

Jeff White
Take a trial to my Stock Pick Service to get my trades.

Follow @TheStockBandit

How Many Trading Positions is Too Many?

April 10, 2014 By Jeff White Filed Under: Q&A

Plans, if drawn up correctly, can give a man direction.
Poorly-formed plans, however, can lead to ruin.

toomanyposRecently I heard from a reader who had been doing some calculating.  That potentially dangerous activity had led him to set up a plan for earning his income through trading.  No problem there, but he wanted to invest a couple hundred thousand dollars into as many as 80 active positions with a holding time of 2-5 days each.  He was having trouble getting up to that many positions.

How many positions is too many?

To start with, it would become a full-time job continually managing 80 positions.  But aside from the time commitment, let’s examine the logic here and determine if there’s any merit to this approach.  Here’s a very short list of the first items that come to mind which I see as problematic:

  • Diluted position size.  Assuming $200k on full margin ($400k buying power), max size per trade is $5,000. Non-margin would be $2,500 per position.
  • High rate of churn means tons of time spent entering/closing positions + considerable operating costs via commissions.
  • Index correlation – any portfolio beyond around 20 positions will closely resemble an ETF

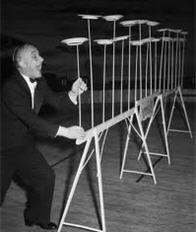
Attempting to run that many positions is essentially a small fund.  Although $200,000 is no small sum, it would certainly be so in the fund world.  Anytime your portfolio starts to resemble the broad market, just go with SPY or something reflective of whatever it is you’re holding (ex: QQQ for heavy tech exposure).  There’s no benefit to trying to spin all those plates of staying on top of earnings announcements and darting in and out when all you’re doing is trying to run a miniature fund.  Abort that plan and simplify with an ETF if you want that much diversification.

My personal style is such that I take fewer trades, but that has some big advantages.  It reduces churn on my account, which not only frees me up to seek out other plays or tend to other matters, but it also saves me a ton in transaction costs.  Additionally, limiting my activity exposes me only to the best setups, so that I focus on the prime opportunities at any given point in time.  I can maintain tight stops, but because my positions are relatively larger, I still benefit from them nicely when they make good moves.

If you’re looking to be more active in the markets, fewer trading positions will likely serve you better.  Each might entail a bit more risk, but if you’re active, then you’re keeping close tabs on them anyway and maintaining resting orders.  Managing them will be nowhere as stressful and hectic as attempting to manage several dozen at a time on an account that size.  Big funds might do that, but they’re running so much money that they essentially have to.  You and I are more nimble than they are, and we should continually embrace that advantage.  You don’t have to be hyper-active to do well trading.

One last note on number of positions.  Keep a good handle on what your risk tolerance is on a trade-by-trade basis, AND on a portfolio basis.  If at any time you have your hands too full (whether it’s an inability to manage them all or an inability to stomach the risk), it’s too many positions.

Why behave like a tanker when you’re built like a speed boat?

Trade Like a Bandit!

Jeff White
Take a trial to the Stock Pick Service to get my trades.
Follow @TheStockBandit on Twitter

Entries: Stop or Stop Limit?

June 17, 2013 By Jeff White Filed Under: Q&A

I’m asked quite often the following question:

“When buying a stock, do you go with a ‘buy stop’ order or a ‘buy stop limit’ order?”

First, let me just quickly clarify the difference for those who may not already know.  A buy stop order means that once price trades at or through the designated ‘stop’ price, a market buy order is generated.  A buy stop limit order means that once price trades at or through the ‘stop’ price, a limit buy order is generated.

With that out of the way, here’s my answer and why.

When I’m setting up a buy order on a stock, I go with a buy stop.  I’ll designate the ‘stop’ level at which I want price to trade at or through, which is pretty simple for me since I trade so many trend line breaks.  The chart clearly shows me when price will have broken free, so I’ll set a buy stop usually a few cents beyond that price.  This way, once price trades at or through the level I designate, a market buy order is generated.

Because probably 90% of the stocks I trade have at least 500k shares traded daily on average (many of them are well over 1M), there’s ample liquidity.  I’m also sitting at my screens for most of the day, so I’m not worried about getting slipped on a stop order to enter a long position (or short).  I have not been burned in quite a long time on a stop order to enter, which is just a function of the tighter markets we have these days.  There is going to be some occasional slippage, which I simply view as a cost of doing business as a trader.

And on those occasions where it’s a gap situation (obviously a different situation from a wide bid/ask spread), if I get triggered into those well beyond my intended price (3% or more), I’ll just close them right out as the risk/reward of the play has just changed drastically to something more along the lines of 1:1. That will at times mean a gain or loss of a few cents, which over time really hasn’t hurt or helped me on a net basis.  Again, I’m at my screens when that happens so it’s easy to ‘undo’ the trade with a quick exit.

Going with a buy stop order means I can catch every trade, which I really prefer even if it means being headfaked perhaps a bit more often.  I’ve found that some of the very best trades clear a key level and never look back, which is a major issue with using a buy stop limit order.  In a fast-moving market, that limit order may not ever get filled and you’ve tripped over pennies on the way to dollars.

For me, stop orders work well for entering new positions.  For those who are concerned with slippage or who are not at their screens frequently, utilizing stop limit orders can protect against those situations.

Just understand that there is no perfect order type, so it’s important to consider your situation and go with the one that suits you best.

If you need to learn more about what all of this means, look into our Stock Trading Courses. In them, we cover executions and everything else related to active trading.

Trade Like a Bandit!

Jeff White
Take a trial to the Stock Pick Service to get my trades.

Follow @TheStockBandit

What Would This be Worth to You?

June 13, 2013 By Jeff White Filed Under: Q&A

Every week, members of the site are treated to a special feature called Charts on Demand.  As they have questions on individual tickers, they submit them and then once a week I give my technical take via video.

It’s a longer video, but very educational.  Not only does this give our traders a second opinion on the stocks they’re watching, but it also gives them some technical insight that improves their charting skills.  What could this do for you to have another opinion as you navigate the market?

To be clear, I’m wrong plenty and just because I give my technical opinion doesn’t mean it has a crystal ball effect.  Rather, it’s about improving the process each trader is going through when evaluating charts on a regular basis, staying objective, and watching out for subtle clues of building or diminishing momentum.

Here’s a look at today’s video that supplements our Sunday through Wednesday night reports.   We’d love to show you the value in our service, and you can get started here.

Trade Like a Bandit!

Jeff White

Follow @TheStockBandit

Chart Scale: Logarithmic or Arithmetic?

March 27, 2013 By Jeff White Filed Under: Q&A

I was asked this past week why AAPL looked to be above a downtrend line on one chart but beneath the same downtrend line on another. Great question!

The short answer is that the scaling is different on the two charts.

You might have seen the words ‘arithmetic’ and ‘logarithmic’ in your charting program or your trading platform and wondered what they were.  Aside from fancy words you might want to throw around at your next cocktail party, they’re really just references to the spacing of price on your charts.  Arithmetic charts depict price moves in equally fixed increments, whereas logarithmic charts depict percentage moves in equally fixed increments.  There’s more to them than that, but for the purpose of this post, that’s the grass-roots difference.  (For a much more in-depth explanation, here’s a video from the Khan Academy.)

Who, you might ask, would use one over the other?  I’m glad you asked!  Generally, longer-term traders and investors prefer logarithmic charts as they’re wanting to see percentage moves to scale.  And typically you’ll find that shorter-term traders prefer arithmetic charts as they want to see similar $ moves to scale.

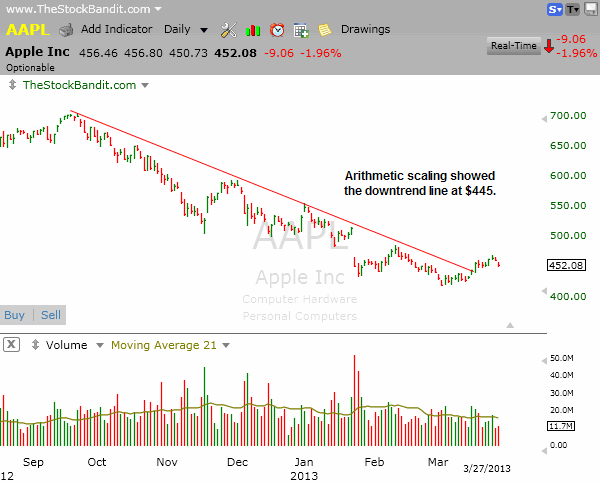
What’s so interesting is that even though the same prices are being plotted on a chart, it can give you a bit of a funky comparison when looking at one vs. another.  At the top of this post I mentioned AAPL in relation to its downtrend line.  It’s now above that trend line on both arithmetic and logarithmic charts, so I’ve clipped back the chart a few days for the purpose of this example.

On the arithmetic chart, AAPL cleared its downtrend line on March 18 as it cleared the $445 level (which I happened to highlight the night before for members).

Why I Use TC2000

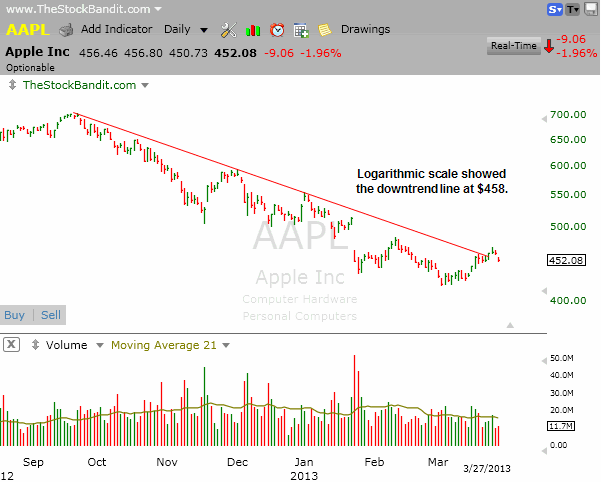
On the logarithmic chart, however, AAPL remained beneath its primary downtrend line until it cleared the $458 level on March 22.

Why I Use TC2000

These two charts highlight very distinct differences even for a very basic trend line crossing.  The arithmetic scale provided an earlier entry in price ($13) in this case, whereas the logarithmic scale required more time before price appeared to be on the move.  To a swing trader like me utilizing trend lines frequently, that’s a significant difference.

Decide what’s best for you, and understand which of the two are most relevant to your trading style and timeframe.

Trade Like a Bandit!

Jeff White
Take a trial to our Stock Pick Service to get our trades.

Follow @TheStockBandit

Is the 50-day Moving Average Relevant?

March 26, 2013 By Jeff White Filed Under: Q&A

The 50-period moving average is one often used by traders.  In fact, simply applying a moving average to a chart will in some programs even default to a 50-period, and it’s one you’ll find on the charts depicted in many trading books and magazines.

It’s clearly popular, but is it relevant?

Maybe.

My take on moving averages is that they should only be applied when a trend is present, should only be relied upon as confirmation of what you should already be seeing in price, and that they should be customized to fit the pace of the existing trend.  After all, that’s what a moving average is showing you – the pace of the trend.

What I mean by that is that a stock that’s accelerating higher with exceptional momentum should have a different period moving average than the steady-as-she-goes creeper of a stock.  Generally speaking, the hotter the pace of the trend, the smaller should be the period of the MA.  Likewise, the slower the pace of the trend, the more useful a longer-period moving average will be.  Read this paragraph again slowly before you proceed!  Too many traders think there’s magic in a moving average, but it’s simply something to reflect the pace of the trend, whether it’s a 50-period, a 13-period or any other number.

So there’s the explanation of it.  Let’s get to what matters:  some examples.

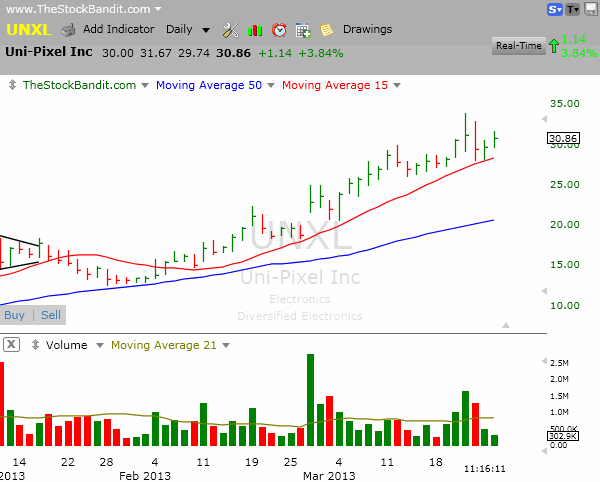
Up first is UNXL, which has been moving higher at a very rapid pace to put it mildly.  The 50-day MA (shown in blue) is nowhere close to price, and therefore is completely irrelevant.  Perhaps it was useful pack in late January, but keep in mind that as the trend accelerates in pace, the slower moving averages will simply get left behind and no longer matter.  In this case, the 15-day MA (shown in red) has been keeping the recent pace of the trend.  The stock is trending with great momentum, and a shorter period moving average is far more useful right now.

Why I Use TC2000

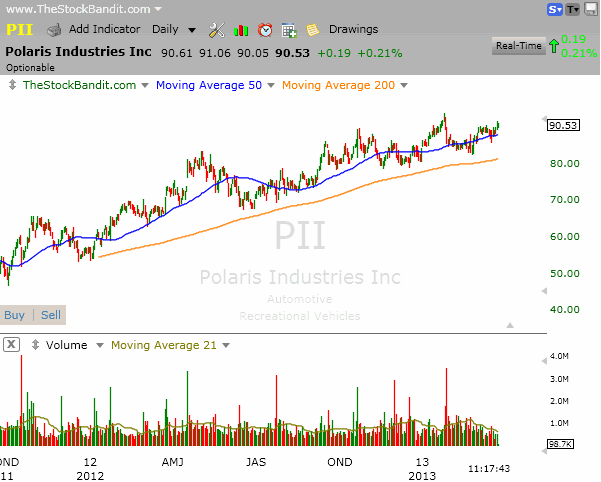
Up next is PII, which has been moving at a really slow pace.  This is your grandfather’s uptrend, and the 200-day MA (shown in orange) is more useful here because it more closely tracks the pace of the trend.  It’s a period that has been respected multiple times in recent months, whereas the (blue) 50-day has been totally ignored numerous times by price – it’s irrelevant because the pace of this trend is slower.

Why I Use TC2000

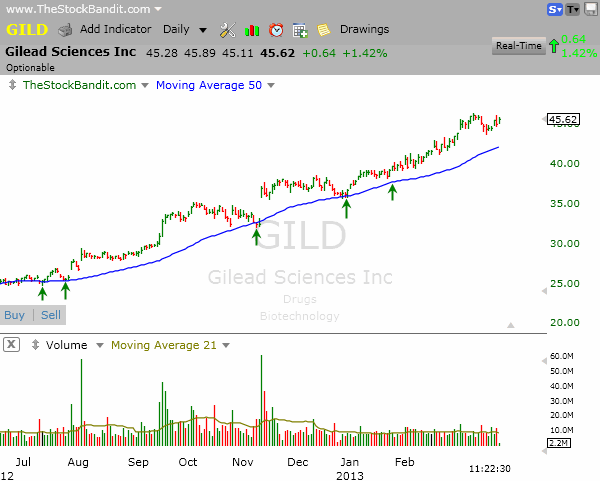
GILD, on the other hand has been respecting the 50-day for some time now.  Pullbacks to that area have proven to be good entries on the long side.  Although it still guarantees nothing going forward, the 50-day has proven useful for many months in this particular stock.

Why I Use TC2000

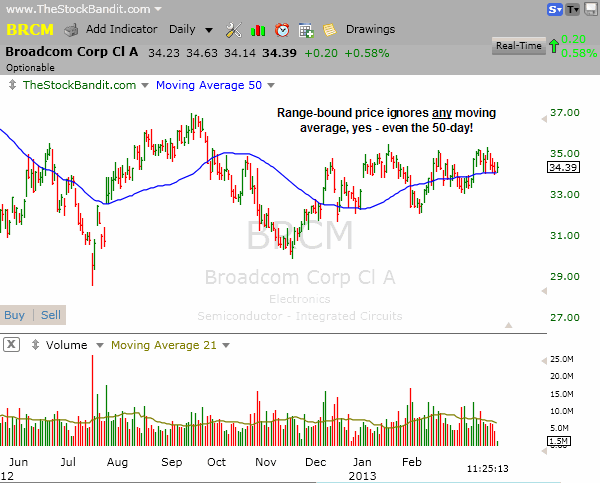
Finally, remember that all stocks will completely ignore ANY moving average when price gets caught in a trading range, so no moving average is relevant when that is the case.  Pull them off your charts when that is the case! Here’s a look at BRCM and look at how frequently the 50-day MA was ignored as price zigged and zagged across it in recent months:

Why I Use TC2000

Here’s the bottom line:  the 50-day MA might or might not be useful.  Far too many traders leave it on their chart indefinitely and give it undue credit in too many cases.  As price approaches it, they say “well there’s the 50-day so this is a good setup” and they don’t even stop to examine whether the 50-day MA has even been relevant recently. Don’t make that senseless mistake!

Instead of applying it (or any other fixed moving average) to every chart you examine, why not create a custom-made indicator for the trends you’re looking at?  Maybe a faster MA will be more useful, or maybe a slower one.  Just don’t get tied to one fixed-pace moving average and decide it’s the be-all, end-all solution for your trading, because that simply is not the case.  Be more creative than that!  Fiddle with the period until you get something useful!

If this is over your head and you need the 101 on technical analysis, don’t worry.  That is the kind of thing we teach in our Basic Course, and you need to be in that course if you need more help understanding the charts or the fundamentals of trading.

Trade Like a Bandit!

Jeff White
Take a trial to our Stock Pick Service to get our trades.

Follow @TheStockBandit

Q&A: Deciding on a Trade Timeframe

December 18, 2012 By Jeff White Filed Under: Q&A

I was just asked by a trader about how I determine my holding time for positions (trade timeframe).  Specifically, Brian asked:

If you buy a pattern breakout off the daily (chart), how do you know it will run? I “thought” you might take some of these and see where they go, meaning if it closes at the HOD you would hold for a swing/multi day move. If not, you might just bail and scalp it?

So what Brian is asking is whether I’m gauging the price action to determine my holding time. Stated another way, he’s asking if I am deciding on overnight positions based upon how well a stock is acting.

Here’s what I told him…

Hey Brian,
I identify my timeframe for the trade before entering, so I know how I’ll expect to manage it (tighter for day trades, a little more room given to swings) going into the trade. I determine this based on the quality of the pattern and the size of the pattern. The cleaner the pattern and the more time involved in the development of it, the longer the timeframe I think it’s valid for. The smaller the pattern, the less time I’ll trust it.

For example, a pattern like a bull flag….

One which has 3 sharp up days and then 4 rest days (flag), I’ll likely take for a shorter timeframe like a day trade.

Another which has 7-8 up days and then 10-12 days of rest to build the flag, I’ll likely take for a longer timeframe like a swing trade.

Basically, it’s a matter of trust and validity. The bigger patterns pull in traders of multiple timeframes, which can produce a longer-lasting move. On the flip side, the smaller patterns tend to pull in only traders on the shorter timeframes, which to me means the move should not last very long and I’ll need to bail after the initial move.

For me, deciding on my trade timeframe prior to entry also helps me size my position properly.  It’s not the only way to do it, but it is what works best for me.

Trade Like a Bandit!

Jeff White
Take a trial to our Stock Pick Service to get our trades.

Follow @TheStockBandit

  • 1
  • 2
  • Next Page »

Member Login

Become a Member Now
Lost Password


Recommended Broker


Links & Archives

Trading Blog Archives
Join the Email List
About Jeff White
Stock Trading Courses
Testimonials
Recent Performance

Post Categories

Stock Charts Posts
Q&A Posts
Index Charts Posts
Trader Improvement
General Blog Posts

Links

Terms of Service
Privacy Policy
Disclaimer
Site Map
Contact us

Follow


Premium Services

Stock Pick Service
Trading Courses
Trader Coaching

Copyright © 2025 TheStockBandit, Inc. · All Rights Reserved