TheStockBandit.com

Swing Trading and momentum investing stock pick newsletter and swing trading service.

  • Home
    • Blog Archives
    • Blog Categories
  • About
    • About The Stock Bandit
    • FAQ
    • Contact Us
  • Strategy
    • Join the Email List!
    • Stock Trading Methodology
    • Trading Rules
    • Chart Patterns
  • Products
    • Products Overview
    • Trading Courses
    • Stock Pick Service
    • Recent Trades
    • Trader Coaching
    • Seminar DVD’s
  • Subscription Info

What’s With All the Streaks?

June 18, 2014 By Jeff White Filed Under: Stock Charts

Streaks. They’re everywhere all of a sudden – have you noticed?

There has been some highly unusual price action to see them so widespread, and they can be found right now on both the upside and downside.

Beyond the novelty, we have to wonder what these are saying about the current market structure.  Have the bots gone crazy?  Maybe, but just like the board posted beside the roulette wheel in Vegas, they don’t mean anything in terms of what’s next.

There’s still roughly a 50/50 chance that the next bar will be green or red.  Fading streaks rarely pays, so don’t jump to any big conclusions about easy money once you find one.  They could continue to defy gravity, or a reversal just might kick in anytime.

Here are a few stocks which are streaking right now:

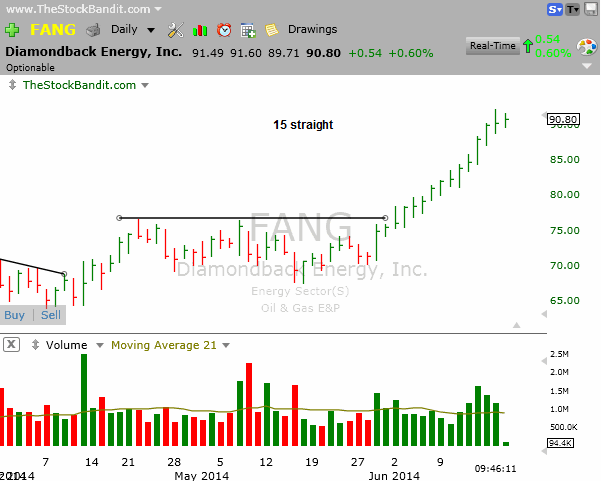
FANG still doesn’t want to relent and the current advance stands at 15 straight.  Shorts are in pain and longs are downright greedy into this parabolic move.
FANG-06182014

Why I Use TC2000

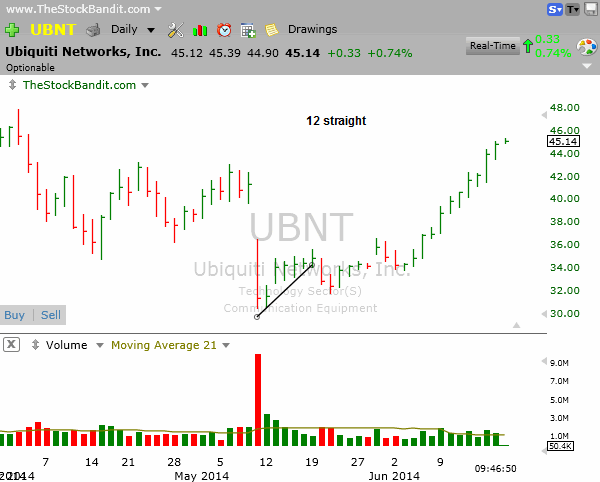
UBNT has been straight up for 12 sessions now.
UBNT-06182014

Why I Use TC2000

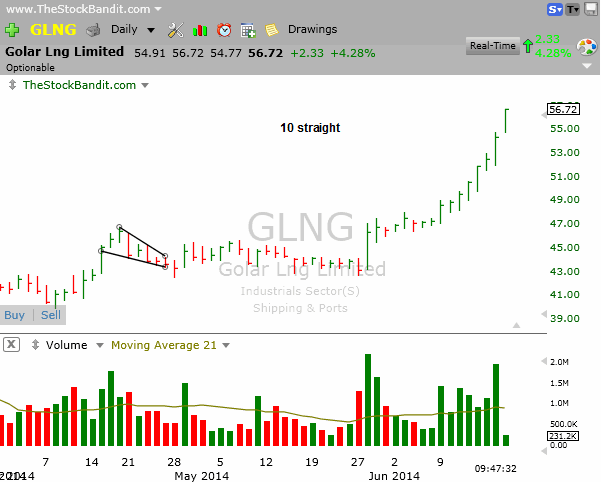
GLNG is going parabolic as well as it reaches double digit days at 10 straight with no signs of letup.
GLNG-06182014

Why I Use TC2000

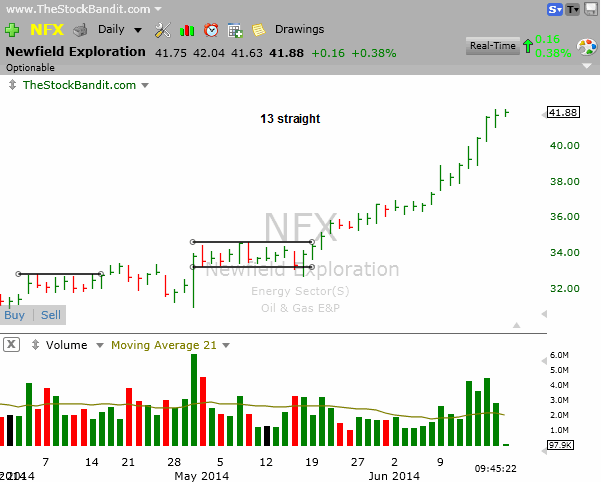
NFX is working on number 13 today (also 16 of 17).
NFX-06182014

Why I Use TC2000

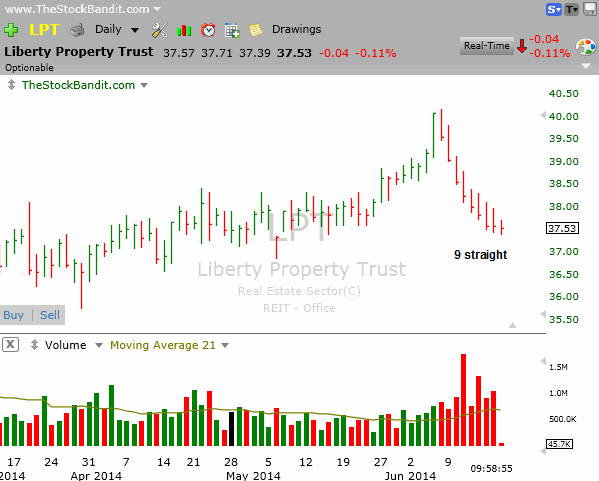
LPT has been streaking on the downside, currently working on its 9th straight decline.
LPT-06182014

Why I Use TC2000

The list goes on to include others like SZYM, WAGE, BCOV and others.

But what if price finally turns around, what should you expect?

No predictions here, but keep in mind the old adage the trend is your friend. Streaks which have recently been broken have not been met with sudden reversals. Take these, for example…

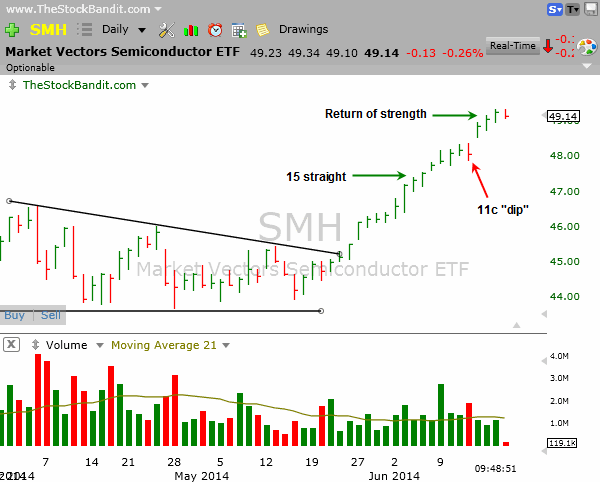
SMH saw 15 straight advances before it finally relented with a whopping 11c selloff.  After that, it was right back on the northbound train to continue the trend.
SMH-06182014

Why I Use TC2000

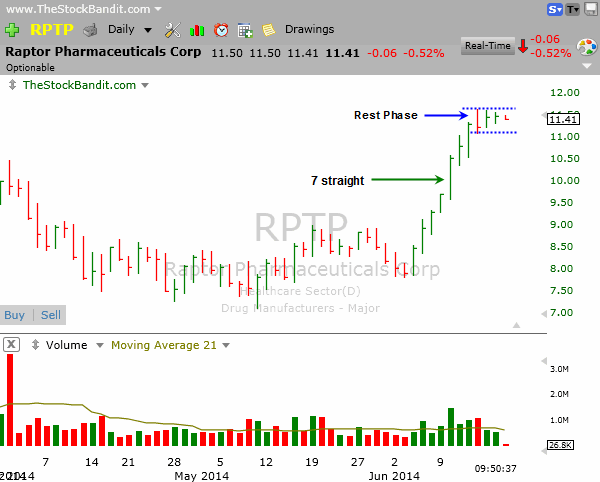
RPTP ran 7 straight days before red returned, but that has simply set off a short-term rest just a short distance from the highs, not a downside reversal.
RPTP-06182014

Why I Use TC2000

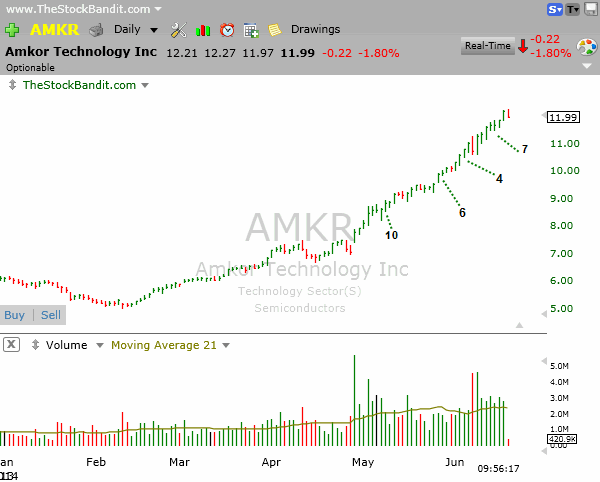
AMKR is perhaps the best example to show. It has had several streaks just since May, including 10 straight, 6 straight, 4 straight, and 7 straight. Each was interrupted by a little red, but in every case it was simply a temporary pause before the trend continued.
AMKR-06182014

Why I Use TC2000

Contrarian trading can be a great approach in the markets. However, it’s usually best to employ such a strategy when price has been indecisive anyway or a key level is being approached – not when price is on a nonstop run into oblivion. Stepping out in front of the proverbial freight train for a hero trade can bury you, so pick your battles carefully.

If you want to learn more about my different trading approaches, including reversals, check out the stock trading courses. They come with lifetime access and I’ll help you directly when you need it.

Trade Like a Bandit!

Jeff White
Take a trial to the Stock Pick Service to get my trades.
Follow @TheStockBandit on Twitter

Month in Review (May 2014)

June 6, 2014 By Jeff White Filed Under: Stock Charts

It’s time once again to take a look back and review some trades from May now that the month is over.  Trade reviews help us identify some common themes among the plays which are working best, which helps keep our focus in the right kinds of stocks.

So today, here’s a look at some of the single-day plays from May which worked out well.  I like to trade on both the day and swing timeframe, so these single-day plays are in my view the cashflow trades which get me through the week – especially during this past month with the broad market so choppy and swings having been tougher to locate.

These single-day plays generally have daily charts looking ripe for a move, but are not high-quality swing setups.  By grabbing them for trades lasting from a few minutes to a few hours, there’s some good opportunity to capitalize on without incurring much risk at all.  In fact, on nearly all my single-day trades, I’m only risking 1% from my entry, which keeps losses small when they happen and allows for a nice multiple of that on the profit side when trades get going.

These kinds of trades are shared nightly with Bandit members, and I tend to turn to them when I don’t trust the chart or the market for a lasting move, or when the bases are too loose to justify a much wider swing stop.  Once in, I look to ride any existing momentum or follow through by way of the intraday chart.

Understand that although the charts below highlight winners, I do take plenty of losing trades.  Those of you who read my posts know the importance I place on losing properly, as losing trades are part of trading.  By sharing the charts below, my aim is to shine some light on the best kinds of plays working for me lately.

This is not a comprehensive list at all, as there were many more trades in the 1-3% range which added up nicely.  But this will give you a snapshot of the kinds of plays I take for the single-day timeframe.

May:

SUNE-may-2014

Why I Use TC2000


CRM-may-2014


WDAY-may-2014


THRM-may-2014


AFOP-may-2014

Why I Use TC2000


SSYS-may-2014


FSLR-may-2014


WUBA-may-2014


ALNY-may-2014


LNG-may-2014

Why I Use TC2000


In recent weeks, I’ve focused on lateral level breaks, as well as pivots from descending and ascending trend lines.

You may be wondering…is a membership worth it?  Well, it starts out with a free trial and then you get plays like those listed above.  Absolutely, it’s worth it.  But on top of that, I’m always available to help out members here.  If you want to tap into my experience and improve your approach, I’d love to work with you.

I dig out the best setups in the market each day, structure my trading plan for the following session, then share those trades with members via the nightly report.  They include swing trades and single-day trades like those above.  Not only am I explaining where I’m looking to trade them, but I also explain why I’m looking to trade them.  So if these are the kinds of plays you like to take, you now know where to find them.

Give it a try today.  Start making more from your trading!

Trade Like a Bandit!

Jeff White

Month in Review (Apr 2014)

May 13, 2014 By Jeff White Filed Under: Stock Charts

Looking in the rear view mirror on occasion can be helpful, not just in life but in your trading as well!  Don’t live in the past or dwell on it, but review it from time to time for the lessons it will no doubt offer.

When doing so, try to find some common themes for what’s working well, and what is not.  Understanding the kinds of plays to seek more of or to avoid helps you stay on the right track.

I wanted today to look back on some of the single-day plays from last month which worked out well (swings are updated here).  I like to trade on both the day and swing timeframe, so these single-day plays are in my view the cashflow trades which get me through the week – especially during April when the broad market was so choppy and therefore fewer swing trades surfaced.

The idea isn’t to jump into and out of trades like a maniac!  Rather, the daily charts on these had them looking ripe for a move, but not as multi-day swings.  By grabbing them for trades lasting from a few minutes to a few hours, there was some good opportunity to capitalize on without incurring much risk at all.  In fact, on nearly all my single-day trades, I’m only risking 1% from my entry, which keeps losses small when they happen and allows for a nice multiple of that on the profit side when trades get going.

These kinds of trades are shared nightly with Bandit members, and I tend to turn to them when I don’t trust the chart or the market for a lasting move, or when the bases are too loose to justify a much wider swing stop.  Once in, I look to ride any existing momentum or follow through by way of the intraday chart.

Understand that although the charts below highlight winners, I do take plenty of losing trades.  Those of you who read my posts know the importance I place on losing properly, as losing trades are part of trading.  By sharing the charts below, my aim is to shine some light on the best kinds of plays working for me lately.

This is not a comprehensive list at all, as there were many trades in the 1-3% range which added up nicely.  But this will give you a snapshot of the kinds of plays I take for the single-day timeframe.

April:

X-apr-2014

Why I Use TC2000


FEYE-apr-2014


SINA-apr-2014


KORS-apr-2014


GOGO-apr-2014


GPRE-apr-2014

The best plays lately on the long side have largely been buys after pullbacks, while the short side has offered some nice failed bounces as well as breakdowns through lateral support levels.

You could be making more from your trading!  If these are the kinds of plays you like to take, now you know where to find them.

I dig out the best setups in the market each day, structure my trading plan for the following session, then share those trades with members via the nightly report.  They include swing trades and single-day trades like those above.  Not only am I explaining where I’m looking to trade them, but I also explain why I’m looking to trade them.

If you’re not a member, why not give it a try today?

Trade Like a Bandit!

Jeff White
Take a trial to the Stock Pick Service to get my trades.

Follow @TheStockBandit

5 Setups to Watch This Week

May 4, 2014 By Jeff White Filed Under: Stock Charts

Potential catalysts failed to spark a meaningful move last week, and the bulls ignored additional opportunities to produce a breakout.  All eyes are on them this week as we see which side wins the battle with the indexes sending some mixed signals.

I reserve my daily trading plan for members of the site, but I wanted to share 5 setups of interest with you as we head into a new week of trading.

Put them on your radar and keep assessing them daily. As setups are negated or fail, seek out some replacements. As setups confirm their patterns, observe their price and volume behavior closely to gauge whether or not they still have some gas in the tank.

By the way, I do not have any positions in the stocks listed and am only interested in entries beyond the highlighted levels. Should price fail to push beyond the levels listed, I’ll take no action.  Price provides the proof, then I make an entry. Here we go:

HAL has a bullish base here and a break above the upper trend line puts it back in motion.

HAL-05042014

Why I Use TC2000

PVA has pulled back in a similar fashion to the prior dip and again faces a descending trend line.  A push through and the highs are the next stop.  Earnings are due out a week from Monday (5-12) according to Yahoo! Finance.

PVA-05042014

Why I Use TC2000

CERN continues to trend lower and this appears to be a bounce within that trend rather than a lasting change of direction. A break below rising support may invite more selling.

CERN-05042014

Why I Use TC2000

GTLS bounced back to test former support from below last week and has so far failed to reclaim it.  A rollover move from here and additional weakness kicks in to continue the downtrend.

GTLS-05042014

Why I Use TC2000

WDAY has bounced but still has lower highs in place.  A break of rising support and downside momentum could easily reappear.

WDAY-05042014

Why I Use TC2000


Through the nightly service, I share swing trade setups with members here including my planned entry, stop, and target levels. Check out the trial if you’d like to kick the tires.

Trade Like a Bandit!

Jeff White
Take a trial to our Stock Pick Service to get our trades.

Follow @TheStockBandit

The Left-Field Move ($SUNE)

April 23, 2014 By Jeff White Filed Under: Stock Charts

To be up-front, let me just say that trading from the charts provides no guarantees.  The spectrum of opinions on it is wide, ranging from some who call technical analysis hocus-pocus to others who swear by the accuracy of their obscure indicators.  Of course, there’s everything in between too.

For me, the charts are more than just an engagement tool, although I don’t ignore all else.  Earnings, for example, are events which are fundamental and ground-moving, plus they’re scheduled, so since they often produce sizeable gaps I always try to avoid them.  But the price action is what I base my decisions on, because I believe there’s a lot reflected in the price action.

On the charts, we get a reflection of where supply (highs) and demand (lows) are, as well as just how broad the participation is (volume).  It’s a picture of group psychology, it’s the picture of how attitudes have played out.  Even better, it’s real-time so everyone gets the same information simultaneously, which is more of a level playing field than something like analyst actions (upgrades/downgrades) which some folks are privy to ahead of time.

Trading from the charts is not perfect though.  That’s of course why I place such an emphasis on losing the right way, knowing that I’ll at times be dead wrong no matter what I thought the chart looked like.  But aside from being right or wrong, there’s also the element of surprise.

Sometimes we see a left-field move, out of the blue, fill-in-your-cliché.  A move which flies in the face of the story which the price action had been telling.  And you know what?  Nothing can be done about it, so when you’re caught by surprise and it’s off and running while you’re flat-footed, just let it go.

On Tuesday, one of those moves came in $SUNE.  From a price-action standpoint, the case for a failing bounce was certainly credible:

  • Lower highs have been in place since March 6th with every bounce being met with supply at lower levels.
  • Several descending trend lines were temporarily broken in recent months, only to fail just days later.
  • Last week’s falling wedge breakout was lackluster and upside volume was diminishing.
  • Price finished off its session high in each of the previous 5 sessions despite advancing.

SUNE-4-22-2014

Why I Use TC2000


The case for a heavy-volume spike higher was certainly not one I would have made.  I had no position in the stock, but when I ran across it last night in my research I just had to make a few points.

Take what you can from the charts, rely on them like I do if you will, but understand as I do that they don’t foretell anything.  They show us what has been happening, and what we do with that is called trading.  No legal approach to trading is perfect – even HFT’s have a down day every year or two!

The charts don’t provide the perfect plan, and there will be missed moves which didn’t appear imminent.  Surprising moves, gravity-defying moves.

I’m still a chartist though.  Studying the price action can still give us an indication of the rhythm of the moves, it can still allow us to be decisive in our actions, and through it we can still often determine the path of least resistance.  After that, it’s all about good management anyway.

Trade Like a Bandit!

Jeff White
Take a trial to my Stock Pick Service to get my trades.

Follow @TheStockBandit

5 Setups to Watch This Week

April 20, 2014 By Jeff White Filed Under: Stock Charts

A 4-session trading week last week gave the bulls limited time to act, but they did the best they could with what they had.  The result was four straight advances for the broad market, lifting stocks from their recent correction lows.  However, it’s not likely to be smooth sailing on the way back up given the lower highs which the averages still have to contend with.

I reserve my daily trading plan for members of the site, but I wanted to share 5 setups of interest with you as we head into a new week of trading.

Put them on your radar and keep assessing them daily. As setups are negated or fail, seek out some replacements. As setups confirm their patterns, observe their price and volume behavior closely to gauge whether or not they still have some gas in the tank.

By the way, I do not have any positions in the stocks listed and am only interested in entries beyond the highlighted levels. Should price fail to push beyond the levels listed, I’ll take no action.  Price provides the proof, then I make an entry. Here we go:

GME has pulled back and stabilized over the past 2 1/2 weeks. Now, a trend line break could produce a quick lift.

GME-4-20-2014

Why I Use TC2000

FSL has pulled back and rested here and now a trend line break at $24.90 could invite attention. Earnings are due out Thursday and I won’t be holding it then.

FSL-4-20-2014

Why I Use TC2000

CHD is facing a breakout from this ascending triangle pattern and a new high at $69.50 frees it up for higher prices.

CHD-4-20-2014

Why I Use TC2000

TRIP has bounced within the downtrend but any rollover from here may invite more selling pressure.  Watch Thursday’s low as a tell.

TRIP-4-20-2014

Why I Use TC2000

INTU is bouncing within a downtrend but a break of rising support would offer a play on the short side as the next leg lower begins.

INTU-4-20-2014

Why I Use TC2000


Through the nightly service, I share swing trade setups with members here including my planned entry, stop, and target levels. Check out the trial if you’d like to kick the tires.

Trade Like a Bandit!

Jeff White
Take a trial to the Stock Pick Service to get my trades.

Follow @TheStockBandit

Month in Review (Feb/Mar 2014)

April 17, 2014 By Jeff White Filed Under: Stock Charts

Whether you’re a member here at the site or not, I want to be in a better habit of looking in the rearview mirror together at some of the trades which have been shared of late with Bandit members.  There are always lessons to be learned when you see which kinds of plays have worked best, which kinds of trades failed, and which were the better movers you may have missed out on.

Because I recently covered the swing performance for this same period, I wanted to go back and review the charts which yielded some of the better single-day moves for me.  I prefer to trade on both the day and swing timeframe, and I view these single-day setups as the cashflow trades to get me through the week, particularly when swing setups are less plentiful.

I’m not a hyper-scalper darting in and out of trades, because these days you can’t compete on speed.  However, these setups look good on the daily charts to me but for a variety of reasons I don’t take them for swings.  Being able to grab these for anywhere from a few minutes to a few hours offers plenty of opportunity to capture as they cross key levels or break out of bases.

I always set these up & share them the night before as single-day plays where I’m only looking to participate in the initial move out of the patterns.  These plays are set up when I don’t trust the chart or the market for a lasting move, or when the bases are too loose to justify a much wider swing stop.

Understand that although the charts below highlight winners, I do take plenty of losing trades.  Those of you who read my posts know the importance I place on losing properly, as losing trades are part of trading.  As per my day trading strategy though, I limit losses on single-day trades to 1% from entry, so the losing trades are extremely small and therefore it’s easy to cover multiple losses with a single decent trade.  My hope in sharing these charts is to share which kinds of plays have generated the best moves for me of late.

Also, the list below does not include all of the winning trades, as there were many others in the 1-3% range which added up nicely.  But this is a snapshot of the kinds of plays I take for the single-day timeframe.

I like to take these for cash-flow trades with a 1% initial stop from entry and aim to ride whatever momentum is present for the day by monitoring the intraday chart.

February:

DDD-feb

Why I Use TC2000


TSL-feb


MU-feb


NQ-feb


SHLD-feb


MNST-feb


YRCW-feb

List: here is a list of many of the single-day movers from Feb. 2014:

feb-list-2014


March:

CTSH-mar2

Why I Use TC2000


NUS-mar


RAX-mar


YPF-mar


CSIQ-mar


PETM-mar


AAL-mar


FANG-mar

List: here is a list of many of the single-day movers from Mar. 2014:

mar-list-2014

The best plays lately have been trend line breaks after pullbacks, followed by lateral level breaks and compression patterns.

You could be making more from your trading.  If these are the kinds of plays you like to take, now you know where to find them.

I dig out the best setups in the market each day, structure my trading plan for the following session, then share those trades with members via the nightly report.  They include swing trades and single-day trades like those above.  Not only am I explaining where I’m looking to trade them, but I also explain why I’m looking to trade them.

If you’re not a member, why not give it a try today?

Trade Like a Bandit!

Jeff White
Take a trial to our Stock Pick Service to get our trades.

Follow @TheStockBandit

5 Setups to Watch This Week

April 6, 2014 By Jeff White Filed Under: Stock Charts

The correction continued last week for the NAZ as it made a new 8-week low.  Meanwhile, the S&P failed its breakout in a big way, and former market leaders simply can’t catch a bid.  It’s a great time for caution, which has been the message of late with the mixed market signals we’ve seen.

I reserve my daily trading plan for members of the site, but I wanted to share 5 setups of interest with you as we head into a new week of trading.

Put them on your radar and keep assessing them daily. As setups are negated or fail, seek out some replacements. As setups confirm their patterns, observe their price and volume behavior closely to gauge whether or not they still have some gas in the tank.

By the way, I do not have any positions in the stocks listed and am only interested in entries beyond the highlighted levels. Should price fail to push beyond the levels listed, I’ll take no action.  Price provides the proof, then I make an entry. Here we go:

BBY has a big unfilled gap from January which it may attempt to partially fill if it can clear $28.30 to make a new recovery high.

BBY-4-6-2014

Why I Use TC2000

WAG has created some short-term lower highs and the current bounce may have run its course. A break below the trend line at $65.60 opens the door for selling.

WAG-4-6-2014

Why I Use TC2000

NEM has lifted from the March low but it has only seen a partial recovery. A break of rising support at $23.90 sets the stage for more downside.

NEM-4-6-2014

Why I Use TC2000

DDD is still acting heavy and now faces key multi-month support. A new low at $54.50 would begin another leg to the downside.

DDD-4-6-2014

Why I Use TC2000

FDO is trying to bounce here but just hasn’t found traction. The trend is down and a new low at $57.20 is likely to trigger more stops as price heads south.

FDO-4-6-2014

Why I Use TC2000


Through the nightly service, I share swing trade setups with members here including my planned entry, stop, and target levels. Check out the trial if you’d like to kick the tires.

Trade Like a Bandit!

Jeff White
Take a trial to our Stock Pick Service to get our trades.

Follow @TheStockBandit

5 Setups to Watch This Week

March 22, 2014 By Jeff White Filed Under: Stock Charts

Stocks struggled late last week, unable to break out from the recent trading ranges. They’ve yet to break down though, so until we see one of the range boundaries crossed we can expect more back-and-f0rth.

I reserve my daily trading plan for members of the site, but I wanted to share 5 setups of interest with you as we head into a new week of trading.

Put them on your radar and keep assessing them daily. As setups are negated or fail, seek out some replacements. As setups confirm their patterns, observe their price and volume behavior closely to gauge whether or not they still have some gas in the tank.

By the way, I do not have any positions in the stocks listed and am only interested in entries beyond the highlighted levels. Should price fail to push beyond the levels listed, I’ll take no action. Here we go:

AAPL has been quiet of late while remaining beneath the multi-month descending trend line. A push north of $536.25 could free it up to move higher.

AAPL-3-23-2014

Why I Use TC2000

SODA has made higher lows in recent weeks but needs to clear short-term resistance.  A rally through $43 would enable the recovery to continue.

SODA-3-23-2014

Why I Use TC2000

HOT continues to channel lower but still isn’t far from resistance. An upside breakout could bring a quick return to the recent high.

HOT-3-23-2014

Why I Use TC2000

ALJ is sitting in a tight bull flag and an upside breakout would pave the way for a possible test of the January high.

ALJ-3-23-2014

Why I Use TC2000

TSLA is testing support and a new pullback low at $227 could produce at least one gap fill, possibly two.

TSLA-3-23-2014

Why I Use TC2000


Through the nightly service, I share swing trade setups with members here including my planned entry, stop, and target levels. Check out the trial if you’d like to kick the tires.

Trade Like a Bandit!

Jeff White
Take a trial to our Stock Pick Service to get our trades.

Follow @TheStockBandit

5 Setups to Watch This Week

March 8, 2014 By Jeff White Filed Under: Stock Charts

Stocks made new highs last week, but remain extremely short-term stretched to the upside. A rest or pullback would be very healthy at this stage, but the bulls just haven’t relented yet.

I reserve my daily trading plan for members of the site, but I wanted to share 5 setups of interest with you as we head into a new week of trading.

Put them on your radar and keep assessing them daily. As setups are negated or fail, seek out some replacements. As setups confirm their patterns, observe their price and volume behavior closely to gauge whether or not they still have some gas in the tank.

By the way, I do not have any positions in the stocks listed and am only interested in entries beyond the highlighted levels. Should price fail to push beyond the levels listed, I’ll take no action. Here we go:

AEO has again held rising support to keep the short-term uptrend intact. A multi-day high could pave the way for a new recovery high soon.

AEO-3-9-2014

Why I Use TC2000

V is at a decision point here within this wedge. A push north of $227 would start a new leg up.

V-3-9-2014

Why I Use TC2000

HOT could soon clear this bull flag pattern and resume its recent strength. The upper trend line stands at $81.50.

HOT-3-9-2014

Why I Use TC2000

CZR is building the handle portion of a very large cup and handle pattern. A new high at $26.80 puts it back on the move.

CZR-3-9-2014

Why I Use TC2000

LNKD is still correcting with lower highs and a break below rising support at $204 could invite more selling.

LNKD-3-9-2014

Why I Use TC2000


Through the nightly service, I share swing trade setups with members here including my planned entry, stop, and target levels. I also produce Charts on Demand for a special Thursday educational video. Check out the trial if you’d like to kick the tires.

Trade Like a Bandit!

Jeff White
Take a trial to our Stock Pick Service to get our trades.

Follow @TheStockBandit

  • « Previous Page
  • 1
  • 2
  • 3
  • 4
  • Next Page »

Member Login

Become a Member Now
Lost Password


Recommended Broker


Links & Archives

Trading Blog Archives
Join the Email List
About Jeff White
Stock Trading Courses
Testimonials
Recent Performance

Post Categories

Stock Charts Posts
Q&A Posts
Index Charts Posts
Trader Improvement
General Blog Posts

Links

Terms of Service
Privacy Policy
Disclaimer
Site Map
Contact us

Follow


Premium Services

Stock Pick Service
Trading Courses
Trader Coaching

Copyright © 2025 TheStockBandit, Inc. · All Rights Reserved