TheStockBandit.com

Swing Trading and momentum investing stock pick newsletter and swing trading service.

  • Home
    • Blog Archives
    • Blog Categories
  • About
    • About The Stock Bandit
    • FAQ
    • Contact Us
  • Strategy
    • Join the Email List!
    • Stock Trading Methodology
    • Trading Rules
    • Chart Patterns
  • Products
    • Products Overview
    • Trading Courses
    • Stock Pick Service
    • Recent Trades
    • Trader Coaching
    • Seminar DVD’s
  • Subscription Info

5 Setups to Watch This Week

March 2, 2014 By Jeff White Filed Under: Stock Charts

The indexes stumbled Friday from their best levels as Russia concerns triggered some profit-taking.  Now traders are considering whether last week’s breakout can stick.

I reserve my daily trading plan for members of the site, but I wanted to share 5 setups of interest with you as we head into a new week of trading.

Put them on your radar and keep assessing them daily. As setups are negated or fail, seek out some replacements. As setups confirm their patterns, observe their price and volume behavior closely to gauge whether or not they still have some gas in the tank.

By the way, I do not have any positions in the stocks listed and am only interested in entries beyond the highlighted levels. Should price fail to push beyond the levels listed, I’ll take no action. Here we go:

SLW has based and this consolidation is tightening. An upside breakout paves the way for another advance.

SLW-3-2-2014

Why I Use TC2000

ESV is quietly basing here and a trend line break through $53.10 could signal continuation of the current recovery.

ESV-3-2-2014

Why I Use TC2000

MU closed at nearly the same price in each of the last 4 sessions as price stabilizes after a dip. This sets up a higher low scenario but a trend line break through $24.50 would add to the effect.

MU-3-2-2014

Why I Use TC2000

NUS is highly news-sensitive but the current bounce may be losing steam.  A break of rising support could trigger some profit-taking.

NUS-3-2-2014

Why I Use TC2000

TWTR is leaning on short-term support but a multi-week low at $53.90 could trigger some stops and invite a test of the $50 area.

TWTR-3-2-2014

Why I Use TC2000


Through the nightly service, I share swing trade setups with members here including my planned entry, stop, and target levels. I also produce Charts on Demand for a special Thursday educational video. Check out the trial if you’d like to kick the tires.

Trade Like a Bandit!

Jeff White
Take a trial to our Stock Pick Service to get our trades.

Follow @TheStockBandit

5 Setups to Watch This Week

February 23, 2014 By Jeff White Filed Under: Stock Charts

The indexes held their ground last week to begin digesting the massive rally off the early February lows. We’re up against some key areas on the daily charts, which should make the week ahead another important one.  There are going to be opportunities on both sides of the tape, so stay alert out there!

I reserve my daily trading plan for members of the site, but I wanted to share 5 setups of interest with you as we head into a new week of trading.

Put them on your radar and keep assessing them daily. As setups are negated or fail, seek out some replacements. As setups confirm their patterns, observe their price and volume behavior closely to gauge whether or not they still have some gas in the tank.

By the way, I do not have any positions in the stocks listed and am only interested in entries beyond the highlighted levels. Should price fail to push beyond the levels listed, I’ll take no action. Here we go:

GT has been building a bull flag for a week and belongs on the radar.  An upside breakout through $27.30 puts it back on the move.

GT-02-23-2014

Why I Use TC2000

WAG is still consolidating after a huge rally but it’s hard to keep momentum at bay for long and we could easily see this one making new highs again shortly.

WAG-02-23-2014

Why I Use TC2000

TGT lifted for a couple of weeks from its lows but gained no sustainable strength. Now, price looks set for another breakdown to continue the overall downtrend.

TGT-02-23-2014

Why I Use TC2000

HLF is a very fickle stock but here it’s respecting rising support after numerous touches in recent weeks.  A downside break would be bearish.

HLF-02-23-2014

Why I Use TC2000

X has held support on multiple occasions but keeps knocking on the door and may soon get through.  A breakdown at $24.35 would allow price to head south in search of buyers at lower levels.

X-02-23-2014

Why I Use TC2000


Through the nightly service, I share swing trade setups with members here including my planned entry, stop, and target levels. I also produce Charts on Demand for a special Thursday educational video. Check out the trial if you’d like to kick the tires.

Trade Like a Bandit!

Jeff White
Take a trial to our Stock Pick Service to get our trades.

Follow @TheStockBandit

5 Setups to Watch This Week

February 16, 2014 By Jeff White Filed Under: Stock Charts

The indexes continued their short-term bounce last week, maintaining some exceptional momentum. That brings with it plenty of bullish charts, yet there are still some bearish setups as well in stocks which are reluctantly lifting from their recent lows.  I’m excited to have opportunities on both sides of the tape here, because regardless of which direction the broad market goes next, there will be some good chances to participate in the move.

Although my detailed trading plan is reserved for members of the site, I wanted to nonetheless share 5 setups of interest I ran across this weekend in doing my research.

Put them on your radar and keep assessing them daily. As setups are negated or fail, seek out some replacements. As setups confirm their patterns, observe their price and volume behavior closely to gauge whether or not they still have some gas in the tank.

By the way, I have positions in none of these stocks and am only interested in entries beyond the listed levels.  Should price fail to push beyond the levels listed, I’ll take no action.  Here are 5 setups of interest for this week:

GTAT has based in recent days following a sharp rally from the $9 range. Now a breakout through $12.05 is the next potential play.

GTAT-2-17-2014

Why I Use TC2000

TK is sitting just shy of multi-week resistance and a breakout through $55 would allow this stock to begin a new leg higher.

TK-2-17-2014

Why I Use TC2000

UAL pulled back from its recent high but has stabilized in recent days.  A turn up through the downtrend line at $45.25 will be needed to put this stock back on the move.

UAL-2-17-2014

Why I Use TC2000

LNC is nearing the apex of this rising wedge and could turn lower again soon.  Price failed multiple times at resistance a few weeks ago and this rising wedge sets up a potential lower high.

LNC-2-17-2014

Why I Use TC2000

ROST has stalled out after a bounce and now a multi-day low at $68.85 could bring a quick return to the $66 area.

ROST-2-17-2014

Why I Use TC2000


Through the nightly service, I share swing trade setups with members here including my planned entry, stop, and target levels. I also produce Charts on Demand for a special Thursday educational video. Check out the trial if you’d like to kick the tires.

Trade Like a Bandit!

Jeff White
Take a trial to our Stock Pick Service to get our trades.

Follow @TheStockBandit

5 Setups to Watch This Week

February 9, 2014 By Jeff White Filed Under: Stock Charts

The indexes covered a lot of ground last week in both directions, ultimately finishing not far from where the prior week ended.  It’s a time to stay on our toes and seek out trades in both directions with the fickle momentum we’re seeing in the current environment.

Although my detailed trading plan is reserved for members of the site, I wanted to nonetheless share 5 setups of interest I ran across this weekend in doing my research.

Put them on your radar and keep assessing them daily. As setups are negated or fail, seek out some replacements. As setups confirm their patterns, observe their price and volume behavior closely to gauge whether or not they still have some gas in the tank.

Here are 5 setups of interest for this week:

HIMX has quietly been basing for a few weeks but this ascending triangle pattern is getting closer to a resolution. An upside breakout sets price free to climb again.

HIMX-2-9-2014

Why I Use TC2000

MRVL is starting to push through a downtrend line and any continuation through $15 adds validity to the breakout.

MRVL-2-9-2014

Why I Use TC2000

SA went through a nasty correction but then based out and is now in the early stages of a big-picture recovery.  Next resistance is $9, giving it some room to rally in the near term.

SA-2-9-2014

Why I Use TC2000

WDC is poised for a push higher but needs to exit this falling wedge.  A breakout could quickly test the $90.44 high from January.

WDC-2-9-2014

Why I Use TC2000

VMW is bouncing but volume is diminishing and the stock could soon run out of steam.  That would create a lower high and set the stage for a deeper correction, particularly with a downside break of $90 if it happens this week.

VMW-2-9-2014

Why I Use TC2000


Through the nightly service, I share swing trade setups with members here including my planned entry, stop, and target levels. I also produce Charts on Demand for a special Thursday educational video. Check out the trial if you’d like to kick the tires.

Trade Like a Bandit!

Jeff White
Take a trial to our Stock Pick Service to get our trades.

Follow @TheStockBandit

5 Setups to Watch This Week

February 2, 2014 By Jeff White Filed Under: Stock Charts

The indexes continued their slide last week but more individual charts are starting to set up now for plays in both directions.

Although my detailed trading plan is reserved for members of the site, I wanted to nonetheless share 5 setups of interest I ran across this weekend in doing my research.

Put them on your radar and keep assessing them daily. As setups are negated or fail, seek out some replacements. As setups confirm their patterns, observe their price and volume behavior closely to gauge whether or not they still have some gas in the tank.

Here are 5 setups of interest for this week:

MGA has pulled back but is trying to stabilize here. A turn up through the trend line could set it free to lift back toward the recent high.

MGA-2-2-2014

Why I Use TC2000

CZR is starting to break out of this descending channel and could soon be challenging the recent high near $24 again.  Any upside continuation would add validity to Friday’s bullish engulfing bar.

CZR-2-2-2014

Why I Use TC2000

FDX was covered here two weeks ago and since then that bearish pattern has played out nicely.  Here the stock looks vulnerable to another decline if the short-term base gets broken to the downside.

FDX-2-2-2014

Why I Use TC2000

BIDU is set to report earnings on Wednesday this week, and I don’t believe in holding stocks into earnings reports. However, it may offer some opportunity in the early portion of the week if it happens to undercut $155 to start another leg lower within its current downtrend.

BIDU-2-2-2014

Why I Use TC2000

X has paused but remains in correction mode.  This rising wedge pattern is bearish and would be confirmed upon a break of the lower trend line, currently at $25.35.

X-2-2-2014

Why I Use TC2000


Through the nightly service, I share swing trade setups with members here including my planned entry, stop, and target levels. I also produce Charts on Demand for a special Thursday educational video. Check out the trial if you’d like to kick the tires.

Trade Like a Bandit!

Jeff White
Take a trial to our Stock Pick Service to get our trades.

Follow @TheStockBandit

5 Setups to Watch This Week

January 20, 2014 By Jeff White Filed Under: Stock Charts

The indexes struggled to make headway last week with a failed breakout in the S&P 500.  The NAZ and RUT each broke out, but have since pulled back to test the breakout zone, putting them in a vulnerable position for failure if the bulls don’t get in gear soon.

Although my detailed trading plan is reserved for members of the site, I wanted to nonetheless share 5 setups of interest I ran across this weekend in doing my research.

Put them on your radar and keep assessing them daily. As setups are negated or fail, seek out some replacements. As setups confirm their patterns, observe their price and volume behavior closely to gauge whether or not they still have some gas in the tank.

Here are 5 setups of interest for this week:

AMGN is facing a potential breakout to an all-time high if it can clear the $120 area.  There’s plenty of blue sky above for it to gain momentum.

AMGN-1-20-2014

Why I Use TC2000

SFUN has been rallying in a rhythmic fashion in recent weeks with several lateral and descending trend lines being cleared. Watch the current pivot for another potential move.

SFUN-1-20-2014

Why I Use TC2000

ORLY is facing major resistance here but a breakout through $135.70 could set this one free to continue higher.

ORLY-1-20-2014

Why I Use TC2000

ZU is facing short-term declining resistance but a push through $41.70 could put it back in rally mode after the recent dip.

ZU-1-20-2014

Why I Use TC2000

FDX stalled out and failed to clear resistance a few weeks ago.  It now is hugging rising support, which could set off a downside trend change if broken in the coming days.

FDX-1-20-2014

Why I Use TC2000


Through the nightly service, I share swing trade setups with members here including my planned entry, stop, and target levels. I also produce Charts on Demand for a special Thursday educational video. Check out the trial if you’d like to kick the tires.

Trade Like a Bandit!

Jeff White
Take a trial to our Stock Pick Service to get our trades.

Follow @TheStockBandit

5 Setups to Watch This Week

January 12, 2014 By Jeff White Filed Under: Stock Charts

Biotechs grabbed the spotlight last week with some jaw-dropping moves in select names, while the major averages lifted quitely within their respective ranges.  The S&P 500 is sitting just beneath breakout territory at 1849, the NAZ needs a close above 4177 to get going again, and the RUT high of 1167 is coming into view.  The bulls could start another leg up any day, but we need to see resistance levels cleared to set that in motion.

Although my detailed trading plan is reserved for members of the site, I wanted to nonetheless share 5 setups of interest I ran across this weekend in doing my research.

Put them on your radar and keep assessing them daily. As setups are negated or fail, seek out some replacements. As setups confirm their patterns, observe their price and volume behavior closely to gauge whether or not they still have some gas in the tank.

Here are 5 setups of interest for this week:

FONR just rested for 3 days to digest the most recent pop but now could go again.  Average volume is light for the past month but price spikes have been accompanied by heavier activity, making it plenty liquid on days it has been moving.

FONR-01122014

Why I Use TC2000

DDD is churning not far from resistance but a breakout could set it free to run again. It may be overdue a pullback, but momentum hasn’t left it yet.

DDD-01122014

Why I Use TC2000

XOP has stabilized after a dip and could easily head back toward the December high.  Check other names in this sector for similar patterns.

XOP-01122014

Why I Use TC2000

JCI is coiling just beneath multi-week resistance with this high-level base.  The high is $51.90, but a push through the whole number could set it free for a lift.

JCI-01122014

Why I Use TC2000

GSVC looks good right here as it starts a new leg up out of a low-level wedge.  Lots of room for a recovery here.

GSVC-01122014

Why I Use TC2000


Through the nightly service, I share swing trade setups with members here including my planned entry, stop, and target levels. I also produce Charts on Demand for a special Thursday educational video. Check out the trial if you’d like to kick the tires.

Trade Like a Bandit!

Jeff White
Take a trial to our Stock Pick Service to get our trades.

Follow @TheStockBandit

5 Setups of Interest

January 5, 2014 By Jeff White Filed Under: Stock Charts

As you prep for the week ahead, checking in on the major averages is always wise but then your attention will naturally turn to individual names of interest.

While my trading plan is reserved for members of the site, I wanted to nonetheless share 5 setups of interest I ran across this weekend in doing my research.

Put them on your radar and keep assessing them daily. As setups are negated, replace them with others.  As setups confirm their patterns, observe their behavior closely to determine whether or not they still have some gas in the tank.

Here are 5 setups of interest for this week:

AAPL is at a key decision point area here as it comes into the $539 level which has been respected on both sides since October.  Following declines in 6 of the past 7 sessions, it’s also a spot for a logical bounce to arrive after a $31 dip.

AAPL-01052014

Why I Use TC2000

MS is sitting in a high channel pattern here and could produce a measured move equivalent to the height of this range ($1.85).  A breakout above $31.90 would need to happen first.

MS-01052014

Why I Use TC2000

YOKU has quietly built higher lows in the past several weeks to show some accumulation taking place on pullbacks.  It’s a slippery stock though, and is no stranger to short-term reversals.  That said, it’s facing a possible breakout if it can clear $32.35 to post a new high.

YOKU-01052014

Why I Use TC2000

NOV is caught in a series of lower highs and currently is resting on the lower end of a rising wedge pattern.  A downside break near $78.50 could spark more selling and there’s an unfilled gap down to $74.30 which price may soon gravitate toward.

NOV-01052014

Why I Use TC2000

FB just failed a breakout and now the short-term bounce is proving unable to reclaim it.  A turn down through $54.40 could trigger another wave of selling and take some of the air out of this big performer since late Nov.  The run may not be over, but this short-term failure and subsequent stalled-out bounce definitely opens the door to some profit taking.

FB-1-5-2014

Why I Use TC2000


Through the nightly service, I share swing trade setups with members here including my planned entry, stop, and target levels. I also produce Charts on Demand for a special Thursday educational video. Check out the trial if you’d like to kick the tires.

Trade Like a Bandit!

Jeff White
Take a trial to our Stock Pick Service to get our trades.

Follow @TheStockBandit

Thinking Outside the Box in $FDX

October 30, 2013 By Jeff White Filed Under: Stock Charts

Stocks on streaks just draw attention.  How many more days?  How much farther can it carry?  When will it shift?

While those questions may come naturally, reality can bring a variety of answers depending upon the situation.  There is no one-size-fits-all answer.

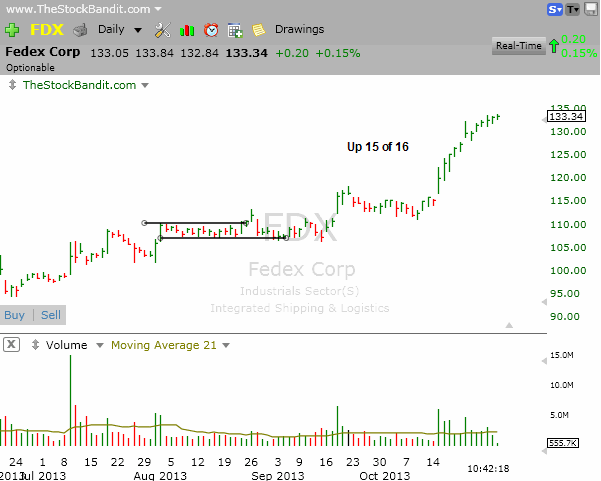
Seeing a stock that’s run a considerable distance, such as FDX right now, invites faders.  There’s an expectation of mean-reversion to some degree in the near term after seeing a stock like this run higher in 15 of the last 16 sessions.  (That’s just 1 decline in over 3 weeks of trading).

But shorting into strength can be a recipe for disaster.  The fact is, momentum is the proverbial freight train – whether up or down – and you don’t want to step out in front of it without a well-defined plan!

Arbitrarily picking a top or a low rarely plays out, but in the case of FDX, there’s a case to be made for a short-term pullback here.  Keep in mind, that doesn’t necessarily mean the end of the run.  It just means the odds for some profit-taking are elevated.  It might defy gravity a while longer, but here’s what I see.

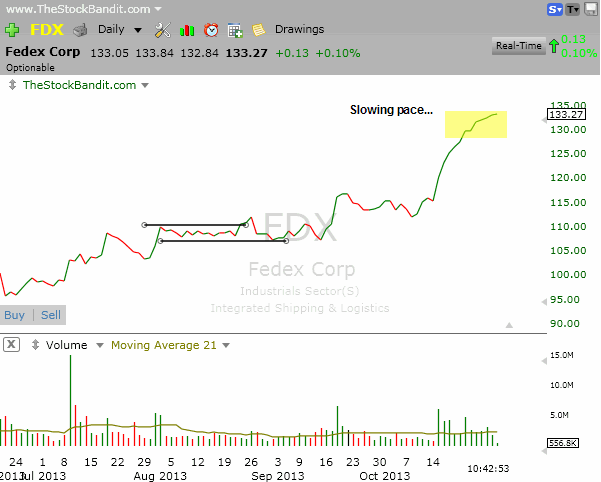
The runup has been impressive, no question.  However, the pace of the move has slowed considerably in recent days, which is to say it appears to be losing some steam.  The HLC chart shows it, but we’ll take a closer look at the rarely-used line chart in a moment that depicts it even better.  Here’s the HLC chart of FDX where it currently sits:

FDX1

Why I Use TC2000

Here’s the line chart, which in this case provides an excellent look at the slowing pace of the FDX rally on day 16:

FDX2

Why I Use TC2000

These types of fade plays require you to stay quick and nimble.  There are shorts in pain who are eager to cover on any dip, and those who are enamored with the stock could just as easily aggressively buy more at lower prices.  Those two dynamics alone could keep a pullback shallow with a built-in bid.

If you’ve been eager to be a seller of FDX, it looks to finally be stalling out here.  Now just watch for some red and don’t overstay your welcome.

Trade Like a Bandit!

Jeff White
Take a trial to our Stock Pick Service to get our trades.

Follow @TheStockBandit

From GOGO to NoNo – Portrait of a Reversal

October 2, 2013 By Jeff White Filed Under: Stock Charts

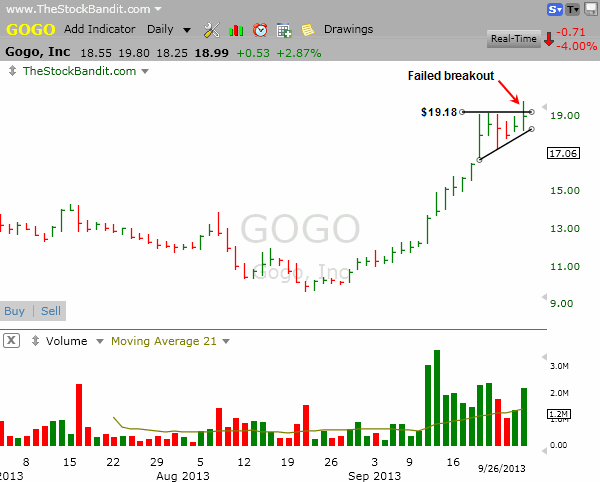
The daily chart of GOGO has been providing some excellent lessons lately.  A few weeks ago it displayed what momentum looks like with it’s short-squeeze-like runup off a fresh August low to make a new all-time post-IPO high of $19.18 on Sept. 20.  Price began to settle down for a few days to digest the move, which formed an ascending triangle pattern to set up a potential second leg higher.

The breakout attempt from Sept. 26 didn’t hold, however, setting a new high only to close back beneath resistance.  That was a failed breakout, which is something no bull ever enjoys seeing.  Here’s a look at the chart up until then:

GOGO1

Why I Use TC2000

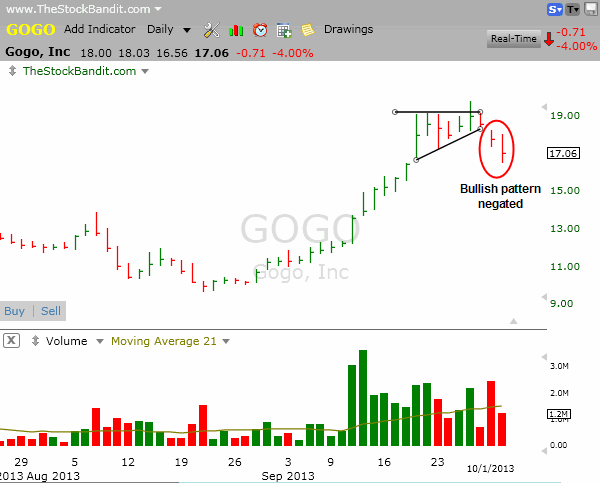
The following day (last Friday, Sept. 27), price tagged the Sept. 20 high to the penny ($19.18) and then finished just 7c off its low on the session.  Then this week, price gapped lower on Monday and has continued to decline in a decisive fashion to completely fail the bullish setup.  Price is now seeing some long-awaited profit-taking and at this point a new support zone will need to be established before a trade opportunity on the long side surfaces.  Here’s how it currently stands:

GOGO2

Why I Use TC2000

Identifying momentum can be a good thing, but it brings with it some warnings.  Locating it while still running hot can deliver some quick gains, but it’s imperative to recognize that it won’t last forever.  High-level bases can certainly produce continuation, but a failure to hold a breakout attempt is always a warning flag worth noting.  And anytime price completely negates a setup, a reversal is underway and should not be ignored.

If you need help understanding chart patterns and the fundamentals of trading, you’re in luck.  This is the type of information we teach you in our stock trading courses.

Trade Like a Bandit!

Jeff White
Take a trial to our Stock Pick Service to get our trades.

Follow @TheStockBandit

  • « Previous Page
  • 1
  • 2
  • 3
  • 4
  • Next Page »

Member Login

Become a Member Now
Lost Password


Recommended Broker


Links & Archives

Trading Blog Archives
Join the Email List
About Jeff White
Stock Trading Courses
Testimonials
Recent Performance

Post Categories

Stock Charts Posts
Q&A Posts
Index Charts Posts
Trader Improvement
General Blog Posts

Links

Terms of Service
Privacy Policy
Disclaimer
Site Map
Contact us

Follow


Premium Services

Stock Pick Service
Trading Courses
Trader Coaching

Copyright © 2025 TheStockBandit, Inc. · All Rights Reserved