TheStockBandit.com

Swing Trading and momentum investing stock pick newsletter and swing trading service.

  • Home
    • Blog Archives
    • Blog Categories
  • About
    • About The Stock Bandit
    • FAQ
    • Contact Us
  • Strategy
    • Join the Email List!
    • Stock Trading Methodology
    • Trading Rules
    • Chart Patterns
  • Products
    • Products Overview
    • Trading Courses
    • Stock Pick Service
    • Recent Trades
    • Trader Coaching
    • Seminar DVD’s
  • Subscription Info

GOOG Searching for Lower Prices?

June 21, 2013 By Jeff White Filed Under: Stock Charts

GOOG has been not just a tech leader, but a market leader since the November lows, putting up gains of more than 40% from its low to the May high (almost twice the performance of the NAZ).

In recent weeks, we’ve seen a gradual pullback in a channel fashion, which was resolved higher earlier this month as the stock began a new leg up, presumably to challenge the highs near $920 from May. However, this week, the stock hasn’t been immune to broad market weakness and suddenly has a very different look on the daily chart. It’s now looking like an intermediate term lower high has emerged (near $910) given the break of rising support off the pullback low.

Time will tell if GOOG is indeed topping, but the astute trader should recognize this as reason for elevated caution. It’s grounds for lightening up on long positions at a minimum, even if the bear case still needs some work.

Here’s a look at the daily chart, where a lower high is in place for now:

GOOG-06-21-2013

Why I Use TC2000


Take a trial to our Stock Pick Service to get our trades.

Trade Like a Bandit!

Jeff White

Follow @TheStockBandit

TSLA Nearing Decision Point

June 12, 2013 By Jeff White Filed Under: Stock Charts

Momentum traders have flocked to TSLA since early May, attracted to both the volatility and the liquidity in the name.  With an Average True Range north of $7 for nearly a month, there’s plenty of movement on any given day.

And yet, since the high was set May 29th, the stock has been wedging.  Rising support going back to mid-May remains intact, and now there’s a descending trend line along the highs.  These trend lines are converging, squeezing price tighter by the day.

This sets up a compression pattern which could be resolved one way or the other any day now.  What appeals to me about this kind of pattern is the fact that anyone taking anticipatory actions ahead of the break who happens to be directionally wrong will have to unwind their position.  For example, suppose the pattern resolves higher.  Bears shorting in expectation of a decline will have to take the same action as bulls who are entering because of the break.  That means both camps take the same action, which is why these can lead to some very explosive moves.

Here’s a look at the daily chart, and it’s clear to see where the battle lines have been drawn:

TSLA-06-12-2013

Why I Use TC2000


Note the smaller but similar wedge which price exited on May 23 for a big 3-day rip.  These setups can pay off nicely, and quick.  Best bet is to wait for the break, as that will provide confirmation of the next direction.

Take a trial to our Stock Pick Service to get our trades.

Trade Like a Bandit!

Jeff White

Follow @TheStockBandit

RHT: Downtrend or Uptrend?

February 19, 2013 By Jeff White Filed Under: Stock Charts

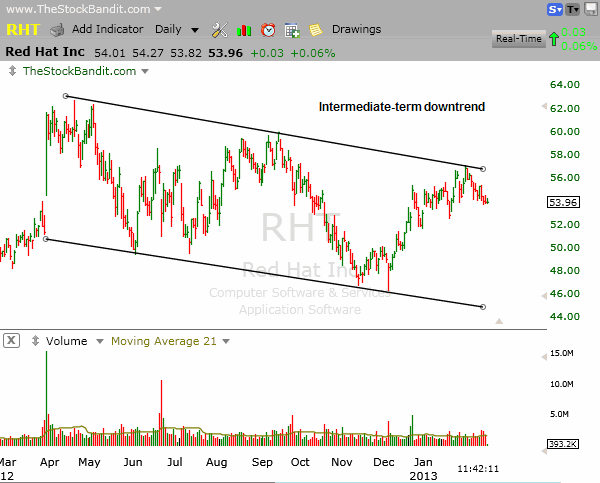
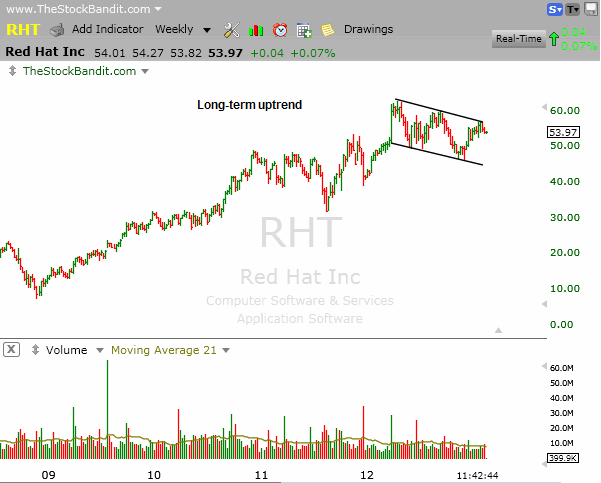
The RHT daily chart is caught in a downtrend channel over the past few months, yet zooming out on the chart reveals what looks to be a pullback within the context of an overall uptrend.

So…who’s right, the bulls or bears here?

Both of them can be, and that’s because your view on a chart and the way you respond to what you see should be a function of your timeframe.

Short-term traders should pay the most attention to the most recent price action, which reveals a bounce within a correction phase that’s been underway since last spring.  Bounces within the channel have been getting sold, so the short side is the one that will pay best until that changes (break of upper trend line, currently near $57).  Also note how choppy the bounces within the channel have been vs. the declines which have been far smoother.

This intermediate-term chart shows RHT working lower in a well-defined channel with bounces to the upper end being followed by smoother selloffs to lower lows.

Why I Use TC2000


Those with a longer-term view see this as a pullback within a longer-term uptrend, which could present another opportunity for upside once it gets resolved.  Those with holding times of months or beyond can wait for a turn up out of this channel to indicate the potential for another leg higher as strength returns.

This long-term weekly chart of RHT shows the stock has produced a sizeable advance over the past few years with the price action of the past few months looking like merely a pullback within the longer-term trend.  A turn up out of this channel would be needed to set this stock back on the course of higher prices, but it’s a real possibility.

Why I Use TC2000


Opinions are a dime a dozen, and that’s not what you need for your trading.  Instead, first consider your timeframe and then seek to discover some if/then scenarios for taking action.

Successful trading isn’t about predicting what happens next, it’s about taking the right kinds of risk with your capital.  That becomes far easier when you stay objective with the price action you’re seeing on your preferred timeframe.

Trade Like a Bandit!

Jeff White
Take a trial to our Stock Pick Service to get our trades.

Follow @TheStockBandit

Stocks to Watch 2-1-2013

February 1, 2013 By Jeff White Filed Under: Stock Charts

This morning I was a guest on a financial radio show, and wanted to share the charts of stocks I discussed on the show. If you’re here for the first time after listening to the show, welcome!

Here are the setups:

ARCO is sitting in a tight wedge here with explosive potential.  A push past $14 gets it going again.

Why I Use TC2000

NOV is sitting in a flag pattern which would be confirmed with a push past the $75 short-term resistance area.  Room to run if so.

Why I Use TC2000

XXIA is basing here after a mild pullback within an uptrend.  A push past $19.25 and the highs come back into view.

Why I Use TC2000

CELG is resting after tremendous momentum with a $20+ move.  A push past $100 sets it free to continue its climb to all-time highs.

Why I Use TC2000

MYL is building up some pressure here and looks ripe for a breakout through $28.60 from this ascending triangle.

Why I Use TC2000

I share setups like these with subscribers all the time. Check out the free trial we’re running right now if you’d like to see what we do.

Trade Like a Bandit!

Jeff White
Take a trial to our Stock Pick Service to get our trades.

Follow @TheStockBandit

5 Wedges to Watch

January 17, 2013 By Jeff White Filed Under: Stock Charts

I’m always working my watch lists in search of great setups to share with subscribers here.  Occasionally, a theme emerges which is worth pointing out publicly.  In this case, I’m sharing a handful of setups with you which all happen to be stocks caught in wedge patterns.

First, let’s consider what a wedge pattern is before getting to the charts…

Essentially, price is getting pressured from two sides in a wedge pattern, and those are easily seen with a descending trend line (the upper line) and an ascending trend line (the lower line).  These kinds of patterns present excellent if/then scenarios.  They don’t require an entry until a penetration of one of those trend lines is made.

Perhaps my favorite part of these setups is that they can produce rather strong moves.  The compression of price for a while tends to build up some steam, so once a battle is eventually won by the sellers or the buyers, both sides tend to take the same action.  They either both start buying on an upside break (getting long & covering shorts), or they both start selling on a downside break (getting short and dumping longs).

Here are 5 wedges to keep an eye on as they get closer to the apex:

MDVN is nearing a resolution here as converging trend lines leave price facing a directional decision.

Why I Use TC2000

DECK remains in a longer-term downtrend but rising support in recent weeks means buyers are emerging more aggressively after dips.  A turn higher could accelerate the recovery here, whereas a turn lower would squash the hopes of new bulls in this stock.

Why I Use TC2000

TASR is resting within an uptrend and this wedge offers a potential pivot for the next leg up to begin.  On the flip side, a downside resolution would likely spark some healthy profit-taking.

Why I Use TC2000

KGC is caught between a pair of multi-month trend lines here, and the next break appears likely to set the tone for the foreseeable future.

Why I Use TC2000

BTU is shaping up after not only holding November support ($23.80) but also the uptrend line which goes back to last summer.  More work is needed if this is to get resolved to the upside, but these two trend lines are the ones to watch.

Why I Use TC2000


Through the service, I share swing trade setups with members here 4 nights per week which contain entry, stop, and target levels.  I also produce Charts on Demand for a special Thursday educational video. Check out the trial if you’d like to kick the tires.

Trade Like a Bandit!

Jeff White

Follow @TheStockBandit

Stocks to Watch 1-4-2013

January 4, 2013 By Jeff White Filed Under: Stock Charts

This morning I was a guest on a financial radio show, and wanted to share the charts of stocks I discussed on the show.  If you’re here for the first time after listening to the show, welcome!

Here are the setups:

AMZN may be building a large cup & handle here, although the handle needs work with more basing.  Regardless, breakout zone is $265 for this high-flyer.

Why I Use TC2000

AAPL remains range-bound as I have been noting.  Plenty of room to fluctuate, but the key levels are $505 and $595 for this tech leader.

Why I Use TC2000

CREE is basing just beneath highs and may be ready to go soon.  Breakout territory is $35.25.

Why I Use TC2000

ANR is just now clearing multi-month resistance and has lots of room to recover.  A push through the $10.30 – $10.50 zone opens the door for much higher prices.

Why I Use TC2000

COH is a potentially bearish setup as it churns near the low end of this multi-month channel.  A breakdown through $53.00 support would indicate the sellers are taking charge.

Why I Use TC2000

Z may be gearing up for an attempt to fill the gap from early November.  Needs to clear $29.25 to get going.

Why I Use TC2000

FB is digesting the big November move with some churn in recent weeks, but a push through $29 puts it back on the move.

Why I Use TC2000

WTW is facing key resistance and may get going as New Year’s dieters benefit this stock after some technical higher lows.  A push through $58.50 resistance paves the way for a continued recovery.

Why I Use TC2000

I share setups like these with subscribers all the time. Check out the trial if you’d like to kick the tires.

Trade Like a Bandit!

Jeff White
Take a trial to our Stock Pick Service to get our trades.

Follow @TheStockBandit

$YHOO Measured Move Met

December 8, 2012 By Jeff White Filed Under: Stock Charts

Back on October 23rd, I covered $YHOO in a video discussing it as a breakout candidate from a $2.40-wide trading range.  Here’s the video which explained it all in 3 mins:

The stock closed above that $16.80 area just 4 days later, and never looked back.  Since then, it’s been on a multi-week run and now it has completely met the measured move originally highlighted in the video, taking it right to $19.20.

Why I Use TC2000

So, now what?

Well, I’ll tell you this:  I wouldn’t fade it.  This stock is running with momentum.  Whether it’s the breakout, elevated expectations after a decent quarter with new Chief Marissa Mayer at the helm (she’s my age!), or hopes for a special dividend ahead of year-end, I just don’t know.  Nor do I care.  The fundamental story isn’t what matters – it’s the price action, and right now it’s bullish.

But at the same time, I wouldn’t establish a new position here.  In fact, I own a position in a long-term account and sold some calls against it this week based on this measured move coming to fruition.  If it gets called away from me, it’s been a great ride and it frees up cash.  If the stock pauses or pulls back, I collect premium while it churns.

However, an entry here begs the question of where to exit, and currently that’s not very clear after a straight-up move.  Once we see some give-and-take and establish some near-term levels, the picture should become more clear.

Hopefully you participated in the move as well.

Trade Like a Bandit!

Jeff White
Take a trial to our Stock Pick Service to get our trades.

Follow @TheStockBandit

Is the $AAPL Swan Dive Over?

November 13, 2012 By Jeff White Filed Under: Stock Charts

The shine has come off of $AAPL since the release of the iPhone 5, and cash has been raised en masse since this stock briefly cleared $700.  But with shares off 23%, the question on the minds of many is whether now is the time to buy.

There has definitely been a dip for those seeking a discount, so by that measure, prices may be attractive.  However, for the astute trader, risk management is of paramount importance – even when buying a “solid company” like AAPL.  (Just ask anyone who thought $630 was a bargain).

In this video, we’ll take a look at the chart and what needs to happen before the coast becomes (more) clear.

Run time is 3:56.

Trade Like a Bandit!

Jeff White
Subscribe to our Stock Pick Service to get our trades.

Follow @TheStockBandit

Bulletproof Home(builders)

November 7, 2012 By Jeff White Filed Under: Stock Charts

Nasty day today out there, no question about it.  Worst day of 2012 for the DJIA, and new correction lows everywhere you look.

Well….almost everywhere.

Everywhere but the homebuilder stocks I should say.  They’re holding up like champs.  Are these things bulletproof?

I’m not suggesting that, but they dodged a missile today.  If these aren’t already on your radar, they should be.  Check out a few of these charts.

KBH gave up less than 1% today and is sitting just shy of recent trendline resistance:

Why I Use TC2000

LEN finished green on the day while the S&P gave up 33 and is facing breakout territory:

Why I Use TC2000

PHM gave up a few cents but stayed in its recent consolidation zone, it’s holding up great:

Why I Use TC2000

RYL isn’t quite breaking out but finished the day down just a couple pennies, holding within its base:

Why I Use TC2000

I’ll of course be sharing my trades on these and anything else I’m stalking inside the Member Area.

Trade Like a Bandit!

Jeff White
Subscribe to our Stock Pick Service to get our trades.

Follow @TheStockBandit

  • « Previous Page
  • 1
  • 2
  • 3
  • 4

Member Login

Become a Member Now
Lost Password


Recommended Broker


Links & Archives

Trading Blog Archives
Join the Email List
About Jeff White
Stock Trading Courses
Testimonials
Recent Performance

Post Categories

Stock Charts Posts
Q&A Posts
Index Charts Posts
Trader Improvement
General Blog Posts

Links

Terms of Service
Privacy Policy
Disclaimer
Site Map
Contact us

Follow


Premium Services

Stock Pick Service
Trading Courses
Trader Coaching

Copyright © 2025 TheStockBandit, Inc. · All Rights Reserved