TheStockBandit.com

Swing Trading and momentum investing stock pick newsletter and swing trading service.

  • Home
    • Blog Archives
    • Blog Categories
  • About
    • About The Stock Bandit
    • FAQ
    • Contact Us
  • Strategy
    • Join the Email List!
    • Stock Trading Methodology
    • Trading Rules
    • Chart Patterns
  • Products
    • Products Overview
    • Trading Courses
    • Stock Pick Service
    • Recent Trades
    • Trader Coaching
    • Seminar DVD’s
  • Subscription Info

SPY Failures Potentially Ominous for Bulls

May 16, 2014 By Jeff White Filed Under: Index Charts

SPY has challenged the $189 level on 11 occasions going back to March 7th.  If that’s not validation of a level, then I certainly don’t know what is.

The big issue for the bulls (and the SPX/SPY) is not so much the proximity to the highs, as they are still within reach, but rather the repeated failures we’ve seen for over two months to clear such an important resistance level given all these big opportunities to break out.  The bulls just can’t seem to get it done, opting to yawn at the chance to press this market higher.  Apathy is the reigning emotion.

After trying to achieve something over and over, it’s easy to get discouraged and at least walk away temporarily to regroup, adjust, and find some renewed focus.

When someone isn’t completing their job satisfactorily, they get fired.

And those two comparisons are each fitting here.  Bulls could easily choose to walk away, especially with the decimation of so many NAZ former leaders and the total disinterest in small caps (RUT).  Speculation seems to be at a multi-month low by that measure.  Couldn’t the bulls “fire” their positions due to an inability to complete the task at hand (start a new leg up)?

Of course they could, and that’s not something to dismiss.  Eventually we’ll either see the lagging indexes play catch-up, or we’ll see the S&P give up the ghost and join the others in a real correction.

What we aren’t likely to see is such a split market last much longer than it already has.  Indexes tend to move together, not completely independent of each other.  Rotation can last a little while, but at some point the overall mood turns positive or negative – there’s no avoiding it.

All of this is being validated by the chart, too.  SPY has been chopping around in a well-defined range of late.  It has spent almost all of its time within the $184 – $189 range since Valentine’s Day, a stretch spanning 64 sessions and 3 calendar months.  Of those 64 trading days, we’ve seen only 7 closes outside the range, with only 3 of them coming on the top side (this week).  We’ve seen other intraday attempts to clear resistance, but it just can’t pull it off.

SPY – The one guarantee we have is that the range game will not last forever:

SPY-5-16-2014

Why I Use TC2000


This is the picture of indecision, which is not what the bulls want to be seeing against the highs over the course of 3 months.

The tone may soon be set for a little market tantrum if the bulls don’t get in gear quickly.  Even those with longer timeframes will have added motivation to take action if no lasting breakout is able to occur.  Why stay in if the prospects for going higher diminish with each failed attempt?

The breaking point might be approaching.  The good news is that the chart will show it when it does, so use it as a guide and be prepared to take action.

Trade Like a Bandit!

Jeff White
Take a trial to the Stock Pick Service to get my trades.

Follow @TheStockBandit

Review of the Indexes 5-11-2014

May 11, 2014 By Jeff White Filed Under: Index Charts

The wait for direction continued last week with the senior DJIA and S&P 500 each finishing again right near resistance while the more speculative NAZ and RUT ended the week not far from their respective correction lows.  Eventually, one side will pull the other along with it, but for now the jury’s still out.

As we head into a new week of trading, it’s time once again to take a look at the indexes and the key levels they’re dealing with. This will impact how individual names move, so it’s where every new trading week should begin.

NAZ – The NAZ has lower highs and higher lows over just the past few weeks, so buyers are getting a bit more aggressive on dips and sellers are staying aggressive on bounces.  Eventually, we’ll see one side win out with either a breakdown or a higher high.

NAZ-5-11-2014

Why I Use TC2000


SP500 – The S&P has repeatedly cleared 1883 on an incremental basis, with each break having failed right afterward. This week, it will have another chance, so we’ll see how a breakout gets treated if it occurs.  An immediate new high (within 2 days or so) would be expected on any meaningful break above this major resistance area.

SP500-5-11-2014

Why I Use TC2000


RUT – The RUT neared major support last week and held, but still has a bearish bias with all the lower highs it has created in the last two months. That needs to change before a bullish bias should be embraced.

RUT-5-11-2014

Why I Use TC2000


DJIA – The DJIA is facing a potential breakout here once again, but likely needs other indexes to exhibit strength in order for a push through to stick.  It’s decision time yet again.  An upside resolution could bring a 550-point measured move out of this multi-month trading range.

DJIA-5-11-2014

Why I Use TC2000


Trade Like a Bandit!

Jeff White
Take a trial to the Stock Pick Service to get my trades.
Follow @TheStockBandit on Twitter

Review of the Indexes 4-27-2014

April 27, 2014 By Jeff White Filed Under: Index Charts

With a shot at resistance levels across the board last week, the bulls couldn’t get it done.  Cash got raised and prices rolled over, which keeps a lid on the market for now.  Are we destined for new correction lows?  Only time will tell, but for now the path of least resistance remains down.

As we head into a new week of trading, it’s time once again to take a look at the indexes and the key levels they’re dealing with. This will impact how individual names move, so it’s where every new trading week should begin.

NAZ – The NAZ stopped short of the prior bounce high last week, then rolled over hard.  This keeps the lower-highs scenario intact and invites a gap fill to 4034, if not a test of prior support.

NAZ-4-27-2014

Why I Use TC2000


SP500 – The S&P knocked on the door of resistance once again last week, but failed to clear it.  Price is now backing off and it looks like a gap fill to 1842 may be next.

SP500-4-27-2014

Why I Use TC2000


RUT – The RUT bounced big from the April low but couldn’t clear 1160 and subsequently rolled over to end the week at 1123.  The correction continues.

RUT-4-27-2014

Why I Use TC2000


DJIA – The DJIA had rallied up to resistance last week after testing support a couple of weeks ago, but it couldn’t muster the strength to break out.  Now cash is getting raised and price is heading lower once again within the range.

DJIA-4-27-2014

Why I Use TC2000


Trade Like a Bandit!

Jeff White
Take a trial to the Stock Pick Service to get my trades.
Follow @TheStockBandit on Twitter

There Are No Rules – /NQ

April 24, 2014 By Jeff White Filed Under: Index Charts

Last night’s hype surrounding $AAPL (and to a lesser extent $FB) sent the futures rocketing after hours. This morning, that strength found follow through with the NAZ futures up well over 1.5% ahead of the opening bell.

But the open for the day marked the high and stocks got smacked against the pavement. The NAZ shed 70 points in 40 minutes, so it was pretty much solid red right out of the starting gate. The NAZ futures went negative within 35 minutes of the opening bell, giving up all those early gains and more.

What too many people fail to remember about the market is that there are no rules. Nothing states that strength or weakness will hold. In reality, the behavior of the market is often just like the weather we get here in the central plains during the springtime…if you don’t like it, just wait a little while – it’ll change!

Here’s a look at the spanking in /NQ with a 3min chart including the after-hours, overnight, and pre-market activity:

NQ-04242014

Chart Provided by TOS


Stay on your toes out there.  There’s a lot of day left.  As we’ve already been reminded, literally anything can happen.

Trade Like a Bandit!

Jeff White
Take a trial to my Stock Pick Service to get my trades.

Follow @TheStockBandit

Review of the Indexes 4-13-2014

April 13, 2014 By Jeff White Filed Under: Index Charts

Snapback attempts failed spectacularly last week as the Thursday/Friday selling pressure easily erased the upside of Tuesday/Wednesday.  Lower highs have been established, and the bulls are behaving as if they have no intention of providing support.  Momentum has shifted and it’s good to have cash on hand as the correction continues.

As we head into a new week of trading, it’s time once again to take a look at the indexes and the key levels they’re dealing with. This will impact how individual names move, so it’s where every new trading week should begin.

NAZ – The NAZ now has 3 confirmed lower highs since topping in March, and now it’s coming into a major level of 3966.  We’ve seen a couple of triple-digit declines here though, which is to say it’s an emotional tape and not necessarily one which will show respect for key levels.  The outlier factor is that it’s short-term stretched on the downside as it comes into this key area, which may allow for a bounce.

NAZ-4-13-2014

Why I Use TC2000


SP500 – The S&P decisively broke 1850 last week and then 1823 by Friday’s close.  The failed bounce mid-week created a lower high and now prices are hitting the dirt quickly as more retracement of the February lift unfolds.

SP500-4-13-2014

Why I Use TC2000


RUT – The RUT is hitting the dirt hard here and also has 3 confirmed lower highs in place.  Next potential area of support is 1079, and at the pace it’s moving, that’s not too far away.

RUT-4-13-2014

Why I Use TC2000


DJIA – The DJIA failed its breakout attempt, fell back into the range, bounced to a lower high, and now is trying to break down from the range.  If it’s successful, there’s no nearby support zone to watch and we could see the selling pressure intensify quickly.

DJIA-4-13-2014

Why I Use TC2000


Trade Like a Bandit!

Jeff White
Take a trial to the Stock Pick Service to get my trades.
Follow @TheStockBandit on Twitter

Review of the Indexes 3-30-2014

March 30, 2014 By Jeff White Filed Under: Index Charts

There are some mixed signals among the averages right now, but there’s reason to err on the side of caution after some hefty declines last week in the more speculative indexes.  Picking and choosing spots is wise given the current conditions, so stay selective out there.

As we head into a new week of trading, it’s time once again to take a look at the indexes and the key levels they’re dealing with. This will impact how individual names move, so it’s where every new trading week should begin.

NAZ – The NAZ gave up 2.8% last week and even the two advances it saw both had weak finishes.  The path of least resistance is down for now.

NAZ-3-30-2014

Why I Use TC2000


SP500 – The S&P finished last week above 1850, but not by much.  It is respecting the trading range but keeps knocking on the door of support.

SP500-3-30-2014

Why I Use TC2000


RUT – The RUT gave up 3.5% last week, once again proving to be the leader in terms of move magnitudes.  To see small caps correcting like this tells us that the hot money is backing away right now.

RUT-3-30-2014

Why I Use TC2000


DJIA – The DJIA peaked before the others and still hasn’t cleared the December high.  However, it’s currently holding its ground.  The big key here is the lower high it keeps respecting.

DJIA-3-30-2014

Why I Use TC2000


Trade Like a Bandit!

Jeff White
Follow @thestockbandit

Review of the Indexes 3-16-2014

March 16, 2014 By Jeff White Filed Under: Index Charts

The DJIA just formed a lower high, the S&P 500 just failed its breakout at 1850, and now the NAZ and RUT are each within 1 point of their respective support levels.  It’s shaping up to be another important week for the market, and we’ll see whether or not the bulls use geopolitical developments as cause for securing profits.

It’s been a good year so far for Bandits as we’ve been able to close out recent profitable trades on both the long and short sides of the market.  This two-way price action should continue to provide us with some great opportunities.  Check out the trial of the stock pick service to get my trades (they’re worth it).

As we head into a new week of trading, it’s time once again to take a look at the indexes and the key levels they’re dealing with. This will impact how individual names move, so it’s where every new trading week should begin.

NAZ – The NAZ has returned to test its breakout level from February at 4246, closing less than 1 point from there on Friday. This pullback has been healthy and needed, but a breakdown here could easily cause the selling to accelerate.

NAZ-3-16-2014

Why I Use TC2000


SP500 – The S&P returned to 1850 last week and then gave it up, making for a breakout failure.  The next level to watch on any additional downside from here will be 1823.

SP500-3-16-2014

Why I Use TC2000


RUT – The RUT is right back to the 1182 area where it peaked in January.  The return to this key level makes for an important test here as we see whether the recent slide from 1212 will hold or accelerate.  Either way, after a 12% lift from the February low, this kind of pullback is healthy.

RUT-3-16-2014

Why I Use TC2000


DJIA – The DJIA has lagged the others and just confirmed a lower high (16505 vs. 16588).  This is an important technical development and now we’ll see if the round number at 16000 will hold.

DJIA-3-16-2014

Why I Use TC2000


VIX – Concern is on the rise, although it’s not anywhere near historically significant levels.  The big number for over a year and a half now has been 20, which is coming into view after this index held a higher level of support recently and then turned up and away from it last week.

VIX-3-16-2014

Why I Use TC2000


Trade Like a Bandit!

Jeff White
Follow @TheStockBandit

Review of the Indexes 1-26-2014

January 25, 2014 By Jeff White Filed Under: Index Charts

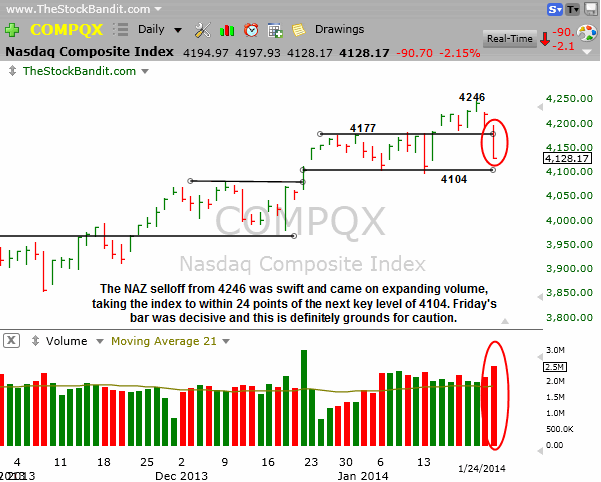
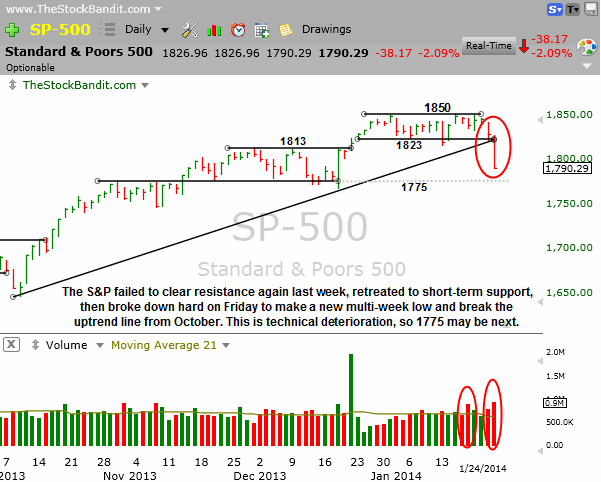
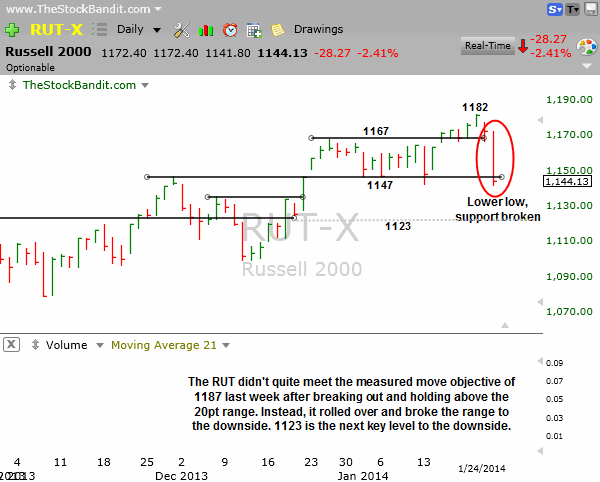
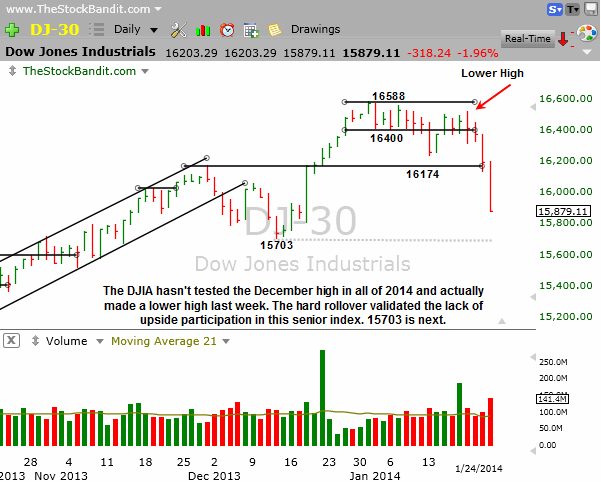
The averages were sending mixed signals as recently as last Wednesday, but by Friday they were all singing the same tune:  selloff.  The NAZ and RUT were making new multi-year and all-time highs, but the blue chip S&P 500 and DJIA each were hesitant to challenge resistance.  The senior indexes dragged the others along for a turbulent ride for Thursday and Friday, leaving each of them with rapidly deteriorating technical conditions.

As we head into a new week of trading, it’s time once again to take a look at the indexes and the key levels they’re dealing with. This will impact how individual names move, so it’s where every new trading week begins.

NAZ – The NAZ took a dive right off its fresh multi-year high from Wednesday of 4246 to finish 118 points lower by Friday’s close. In the process, it gave up 4177 and now stands just 24 points from next key multi-week support of 4104.

NAZ-01262014

Why I Use TC2000


SP500 – The S&P never could clear resistance despite numerous opportunities, including last week.  It turned south on Thursday then hit the dirt on Friday to finish 60 points below 1850.  This hard breakdown from the multi-week trading range (1823) was accentuated by the decisive break of rising support going back to last October.  This index is not in good shape with price action like this, so the bulls are on their heels.

SP500-01262014

Why I Use TC2000


RUT – The RUT was just 5 points from a measured move target of 1187 as of Wednesday, but a hard selloff on Thursday and Friday left it not only below the 1167 breakout but also below the low end of the range at 1147.  This is a huge failure for the small-caps, and now a former high at 1123 is the next level to watch on the way down.

RUT-01262014

Why I Use TC2000


DJIA – The DJIA shed 318 on Friday alone, but was down all 4 sessions last week.  This index has been the clear laggard, and the failure to hold 16400 was quickly followed by a break below the former high of 16174.  Now we need to watch 15703, the December low, as next potential support.

DJIA-01262014

Why I Use TC2000


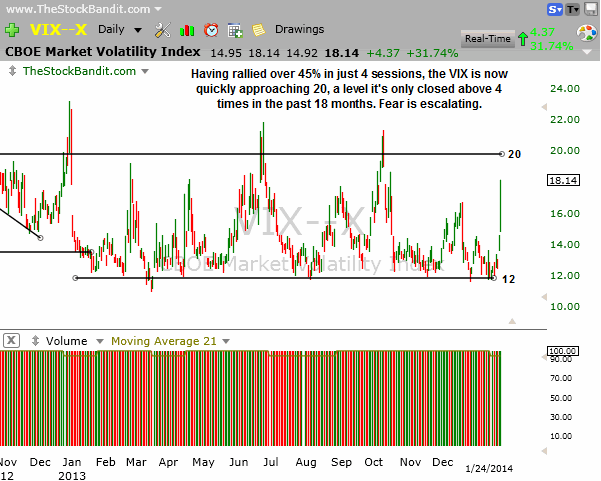
VIX – Complacency is so two weeks ago.  Last week it took a hike.  The VIX spiked big as a result, jumping over 45% in the 4-day trading week to clear 18. This ‘fear index’ is fresh off a test of long-term support at 12, but hasn’t cleared the first real threshold yet. That is 20, which we’ve only seen 4 closes above in the past 18 months. This index belongs on the radar for now as we watch to see if it continues to spike along with broad market weakness.

VIX-01262014

Why I Use TC2000


Take a trial of the Stock Pick Service to get my trades.

Trade Like a Bandit!

Jeff White

Follow @TheStockBandit

Video Review of the Indexes 1-5-2014

January 3, 2014 By Jeff White Filed Under: Index Charts

The market started off the new year on a shaky note last week, but it’s still too early to discount the resolve of the bulls.  Time and again, they’ve stepped in to buy dips, so traders will watch with interest to see if the quick pullback introduces any lasting doubt.

As we head into a new week of trading, it’s time once again to take a look at the indexes and the key levels they’re dealing with. This will impact how individual names move, so it’s where every new trading week begins.

Hit the gear icon on the player to select HD and then go full-screen for best quality.

Run time is 6:06.

Trade Like a Bandit!

Jeff White
Take a trial to my Stock Pick Service to get my trades.

Follow @TheStockBandit

Review of the Indexes 12-22-2013

December 20, 2013 By Jeff White Filed Under: Index Charts

The main event last week was the FOMC meeting, and it did not disappoint.  Tapering began and it was “just right” with stocks ripping higher to show widespread approval.  A day of rest Thursday was chased with follow through on Friday, putting the averages at new all-time and multi-year (NAZ) highs.

This week is of course Christmas week, which means 3 1/2 days of trading rather than the usual 5 (closed all day Wed, closed half day Tues).  The volume is likely to be extremely light as traders shift away from their screens to spend time with family, and then there are just a few days remaining for the year-end window dressing, fund redemptions, and tax-related selling cross-currents.  It’s likely a good idea to tread lightly this week for these reasons.

I do want to wish you a Merry Christmas and thank you for reading TheStockBandit.com this year.  My aim is to bring you more useful content in 2014, and if you’d like help taking your trading to the next level via a nightly trading plan, coaching, or education, let’s set up a call as I’d love to help you meet your trading goals.

NAZ – The NAZ cleared resistance on Friday to exit its 115pt trading range of the past 6 weeks.  This opens the door for a potential rally toward 4196 if a measured move unfolds. The first order of business for the bulls, however, will be to maintain this breakout and not let it fail.  Quad witching and index fund rebalancing delivered giant volume on Friday.

NAZ-12222013

Why I Use TC2000


SP500 – The S&P pushed past 1813 on Friday to break out to a new all-time high.  The finish off the session high only left this index 5 points above the breakout zone, which isn’t a lot of breathing room.  The bulls will want to build on this breakout now to avoid a failure, but a measured move to 1851 is now on the table.

SP500-12222013

Why I Use TC2000


RUT – The RUT tested 1099 less than two weeks ago but rallied right back to make an incremental new high on Friday as it cleared 1147.  It ended the week within a half point of that level, so a more convincing breakout will be needed if this is to avoid the look of a failure at resistance.  The bulls have momentum though, so we’ll see if they can propel the small caps higher.

RUT-12222013

Why I Use TC2000


DJIA – The DJIA faded from its session high on Friday but still managed a 3% jump on the week to reach a new all-time high.  The quick turn back up on Wednesday post-FOMC found follow through in both of the next two sessions, which shows the bulls are taking care of business.

DJIA-12222013

Why I Use TC2000


Take a trial of the Stock Pick Service to get my trades.

Trade Like a Bandit!

Jeff White

Follow @TheStockBandit

  • « Previous Page
  • 1
  • 2
  • 3
  • 4
  • …
  • 8
  • Next Page »

Member Login

Become a Member Now
Lost Password


Recommended Broker


Links & Archives

Trading Blog Archives
Join the Email List
About Jeff White
Stock Trading Courses
Testimonials
Recent Performance

Post Categories

Stock Charts Posts
Q&A Posts
Index Charts Posts
Trader Improvement
General Blog Posts

Links

Terms of Service
Privacy Policy
Disclaimer
Site Map
Contact us

Follow


Premium Services

Stock Pick Service
Trading Courses
Trader Coaching

Copyright © 2025 TheStockBandit, Inc. · All Rights Reserved